
Translate this page into:
Evaluation of multiparametric flow cytometry in diagnosis & prognosis of myelodysplastic syndrome in India
For correspondence: Dr Jasmita Dass, Department of Hematology, Sir Ganga Ram Hospital, New Delhi 110 060, India e-mail: drjasmita@gmail.com
-
Received: ,
This is an open access journal, and articles are distributed under the terms of the Creative Commons Attribution-NonCommercial-ShareAlike 4.0 License, which allows others to remix, tweak, and build upon the work non-commercially, as long as appropriate credit is given and the new creations are licensed under the identical terms.
This article was originally published by Wolters Kluwer - Medknow and was migrated to Scientific Scholar after the change of Publisher.
Abstract
Background & objectives:
Diagnosis of myelodysplastic syndromes (MDS) is subjective in low-grade cases with <5 per cent blasts or <15 per cent ring sideroblasts. Flow cytometry (FCM) has been used to diagnose MDS; but, it still has only an adjunctive role. This study was conducted to evaluate the role of FCM to diagnose MDS and correlate the number of aberrancies with revised international prognostic scoring system (R-IPSS).
Methods:
This study included 44 consecutive clinically suspected cases of MDS with refractory cytopenia(s) and 10 controls. Patients were divided into two groups: (i) proven MDS cases (n=26), and (ii) suspected MDS (n=18). Ogata quantitative approach, pattern analysis and aberrant antigen expression were studied.
Results:
Ogata score ≥2 correctly diagnosed 80.7 per cent (21/26) while aberrant antigen and pattern analysis with flow score of ≥3 could diagnose 92.3 per cent (24/26) patients with proven MDS. Combination of both with flow score ≥3 could diagnose 100 per cent patients. Eight patients in suspected MDS group with persistent cytopenia on follow up were labelled as probable MDS. Ogata score ≥2 was present in 5 of 8 and pattern analysis score ≥3 was present in six probable MDS patients. Combination of both with flow score ≥3 was present in seven of eight patients. Spearman's correlation between Ogata score and R-IPSS, pattern analysis and R-IPSS and combination of both scores and R-IPSS showed significant positive correlation in proven MDS as well as when proven and probable MDS patients were combined.
Interpretation & conclusions:
Our results showed that combined Ogata approach and pattern analysis, demonstration of ≥3 aberrancies in >1 cell compartment could diagnose most MDS patients. Patients with high flow scores had high R-IPSS scores. Patient with flow score ≥3 and borderline cytomorphology should be observed closely for the development of MDS.
Keywords
ELN guideline
flow cytometry
flow score
myelodysplastic syndromes
Ogata score
ring sideroblasts

Myelodysplastic syndromes (MDS) are a group of clonal haematopoietic stem cell disorders characterized by cytopenias, dysplasia in ≥1 cell compartment, ineffective haematopoiesis and an increased risk of acute myeloid leukaemia1. Reported crude annual incidence rate is between 5.3 and 13.1 per 100,000 population2. The median age at diagnosis in most western studies was >70 yr2345. However, the median age of presentation in the Indian population has been reported to be a decade earlier678.
Diagnosis of MDS depends on clinical history of refractory cytopenia(s), documentation of significant dyspoiesis on bone marrow (BM) examination, ruling out secondary causes of dyspoiesis or the presence of clonal chromosomal abnormality (CCA) consistent with MDS on cytogenetics. Morphology alone is predominantly subjective in low-grade cases with < 5 per cent blasts or <15 per cent ring sideroblasts (RS)9. Therefore, diagnosis is difficult in low-grade MDS (LG-MDS) if they lack RS. This is complicated by the fact that CCA are present in only about 50 per cent cases9.
Flow cytometry (FCM) in MDS is characterized by aberrant expression of lineage infidelity markers, decrease in B-cell progenitors and decreased or increased expression of various lineage markers leading to aberrant patterns. Initial studies were directed at aberrant antigen expression on granulocytes and pattern abnormalities in maturing granulocytes and monocytes101112. Ogata et al131415 developed a quantitative approach(Ogata mini-panel) for evaluation of the LG-MDS patients. Other studies16171819 have evaluated aberrant antigen expressions while pattern-based approach has been studied by a few20. The only Indian study in MDS utilized pattern analysis, aberrant antigen expression and percentage of myeloblasts17. None of the studies have used an approach of combining all parameters as per European Leukaemia Net (ELN) guidelines2122 to evaluate the utility of FCM. ELN guidelines were first published in 201221 and updated in 201422 and included all components including Ogata score, aberrant antigen expressions and pattern-based abnormalities.
This study was conducted to evaluate the Ogata quantitative approach (Ogata mini-panel) which included four parameters - granulocyte:lymphocyte SSC ratio (Gra/Ly SSC ratio), lymphocyte:myeloblast CD45 mean fluorescent intensity (MFI) ratio (Ly/Mbl CD45 ratio), per cent CD34+ B-cell progenitors of the total CD34+ cells (%CD34+ B-cell progenitors) and per cent CD34-positive myeloblasts of the total nucleated cells (%CD34+ myeloblasts), pattern and aberrant antigen-based approach (Pattern) and combined approach (Ogata+Pattern) to diagnose MDS. The correlation of revised international prognostic scoring system (R-IPSS) score with number of FCM aberrancies was also studied.
Material & Methods
This was an observational prospective study conducted from September 2014 to May 2016 at the departments of Haematology, Clinical Haematology and Medical Oncology at Sir Ganga Ram Hospital, New Delhi, India. The study was approved the Institutional Ethics Committee, and written informed consent was taken from all the participants.
Patients and controls: Forty four consecutive clinically suspected patients of MDS with refractory cytopenia (i.e. refractory to complete course of vitamin B12 therapy) were enrolled after exclusion of secondary causes of dysplasia including infections such as HIV, hepatitis B, hepatitis C, tuberculosis and history of intake of drugs associated with dysplasia or cytopenias (antitubercular therapy, valproic acid and co-trimoxazole) or history of chemotherapy, radiotherapy or granulocyte colony-stimulating factor. Two cases with lead excess were also excluded.
Diagnosis of MDS was based on WHO 2008 criteria23. The patients were divided into refractory anaemia (RA), RARS, refractory cytopenia with multilineage dysplasia (RCMD), refractory anaemia with excess blast 1 (RAEB1), RAEB2, MDS-unclassified (MDS-U) and MDS associated with isolated del(5q)(5q-syndrome). Cytogenetics was done in 37 of 44 patients (84.1%). The patients were divided into two groups (i) proven MDS cases (n=26) on cytomorphology (n=25) or cytogenetics (n=1) as per the WHO 2008 diagnostic criteria23 and (ii) suspected MDS cases (n=18) i.e. unproven on cytomorphology or cytogenetics but with a strong clinical suspicion. Cytogenetics was done in 22 of 26 (84.6%) patients with proven MDS and in 15 of 18 (83.3%) suspected cases.
The study also included 10 control patients. These were patients having lymphoma with normal haemoglobin, total leucocyte count, absolute neutrophil count and normal platelet count. BM sample for FCM was collected at the time of the BM aspiration and biopsy procedure. The lack of dysplasia was also confirmed on the morphological examination of the BM aspiration smears. Normal pattern of antigen expressions, normal ranges of Ogata mini-panel parameters were established on normal controls. Median age of controls was 54.5 yr (40-62). There was no significant difference between the age of proven [65 yr (45-100)] and suspected [54 yr (37-79)] MDS cases and controls.
Bone marrow examination: All patients underwent BM aspiration and biopsy. An extra 2 ml BM was collected in dipotassium EDTA vacutainer for FCM. Only cases with ≥10 per cent dysplasia in ≥1 haemopoietic cell compartment were taken as MDS. FCM was performed within 24 h of sample collection on 2-laser, 6-colour BD FACS Canto II flow cytometer (BD Biosciences, USA).
Flow cytometry: All antibodies were sourced from BD Biosciences, USA. The following tubes were stained: tube 1- CD16-FITC(CLB/FcGran1)/CD13-PE(L138)/HLADR PerCPCy5.5(L243)/CD11b-APC (D12)/CD45 APCH7(2D1); tube 2- CD7-FITC(4H9)/CD10-PE (HI10a)/CD34PerCPCy5.5(8G12)/CD19PE-Cy7(S J25C1)/CD56-PC(NCAM16.2)/CD45-APCH7(2D1); tube 3- CD38-FITC(HB7)/CD34-PE(8G12)/CD5 Per CPCy5.5(L17F12)/CD117-PE-Cy7(104D2)/CD33-A PC(P67.6)/CD45-APCH7(2D1). The samples were processed using stain-lyse-wash method. Titrated amounts of each antibody were used to stain 100 μl BM sample in each tube. A minimum of 100,000 events were acquired in each tube. An attempt to acquire a minimum of 250 CD34+ progenitor events was made. Till September 2015, FACS Diva 6.1 software (BD Biosciences, USA) was used and from October 2015 to May 2016, FACS Diva Software v 8.0.1 (BD Biosciences, USA) was used for analysis. Daily adjustment of alignment was done using Cytometer setup and tracking beads (BD Biosciences, USA). An unstained control was run with each sample to optimize the forward and side scatters. Parameters of Ogata mini-panel were studied using tube 2.
Aberrant antigen expression and pattern analysis: In tube 1, patterns of HLA-DR/CD11b, CD11b/CD16, CD13/CD11b, CD13/CD16 and expression of HLA-DR on granulocytes and pattern of HLA-DR/CD11b, CD11b/CD16, expression of HLA-DR and CD11b on monocytes were studied. In tube 2, aberrant expressions of CD56 and CD7 on myeloid progenitors, granulocytes and monocytes and expression of CD10 and aberrant expression of CD19 on granulocytes were looked for. In tube 3, aberrant expressions of CD5 on myeloid progenitors, granulocytes and monocytes were studied. Any expression of >20 per cent on myeloblasts, maturing myeloid cells (granulocytes) and monocytes was used to determine aberrant CD56, CD5 and CD7. Normal patterns of CD11b/CD13, CD11b/CD16, CD13/CD16 and CD11b/HLA-DR on granulocytes and CD11b/CD16 and CD11b/HLA-DR on monocytes were established on control population.
Flow cytometric scores: Flow scores were calculated giving one point to each observed aberrancy. Ogata score was calculated using four parameters described in Ogata mini-panel. Score ≥2 was considered suggestive of MDS. For aberrant antigen expression and pattern analysis, aberrant findings in ≥3 tested features comprising ≥2 cell compartments was considered suggestive of MDS22.
Prognostic scores: The patients in proven MDS group in whom cytogenetics was available (n=22) were prognosticated using the R-IPSS into very low risk, low risk, intermediate risk, high risk and very high risk categories.
Statistical analysis: Choosing the power of 80 per cent and desired precision 10 per cent, minimum 60 samples were required to reach statistical significance. Due to the time bound nature of the study we could able to add only 44 samples. Descriptive statistics was applied using SPSS version 20.0 software (SPSS, Chicago, IL, USA). Continuous variables were presented as median or mean±standard deviation (SD). Categorical variables were expressed as frequencies and percentages. Continuous data between the groups was compared using Student's t test. Spearman correlation analysis was used to check correlations between pairs of test results. Reference ranges for the flow score was calculated using receiver operator characteristic (ROC) curve analysis and the concordance index (c-index) was implemented to assess the score with the best discrimination power.
Results
Median age of patients in proven and suspected MDS groups was 65 yr (45-100) and 54 yr (37-79), respectively. In proven MDS group there was male predominance with male to female ratio of 2.7:1. Most common presenting complaint in both groups was weakness and easy fatigability (36/44, 81.8% cases) followed by symptoms of infection (12/44, 27.3%). A positive history of red cell transfusion was present in 23 per cent (6/26) of patients with proven MDS.
Haematological parameters: Median haemoglobin levels in proven and suspected MDS groups were 75 g/l (46-119 g/l) and 73 g/l (33-106 g/l), respectively. Median absolute neutrophil counts were 1.437×10⁹/l (0.0567-6.014×10⁹/l) and 1.856×10⁹/l (0.1498-6.279 ×10⁹/l), respectively, while median platelet counts were 57.5×10⁹/l (11-327×109/l) and 51.5×10⁹/l (10-385×109/l), respectively. No significant difference in haematological parameters was observed between the two groups. Pancytopenia was the most common presentation seen in 53.8 per cent patients with proven and 50 per cent patients with suspected MDS. Peripheral dysgranulopoiesis was present in 19.2 per cent proven MDS and in none of the patients with suspected MDS.
WHO subtype and cytogenetics: Twenty six patients with proven MDS were classified in descending frequency as RAEB-2 (9, 34.6%), RCMD (8, 30.8%), RAEB-1 (4, 15.4%), 5q- (2, 7.7%), hypoplastic MDS (2, 7.7%) and MDS-U (1, 3.8%). CCA was present in only 36.4 per cent (8/22) proven MDS and none of the suspected MDS patients. CCA seen were del(5q) (2 patients), del(5q) and +8 (1 patient), +8 (1 patient), 46XY der(7)t(1;7) (1 patient) and complex cytogenetics (3 patients).
Flow cytometric aberrancies in patients with proven and suspected MDS
Ogata mini-panel: Cut-offs were established using the values obtained in controls and patients with proven MDS. Cut-offs for Gra/Ly SSC ratio, per cent CD34+ myeloblasts and per cent CD34+ B-cell progenitors were determined using the ROC analysis. Cut-off for Gra/Ly SSC ratio was <6.1 with sensitivity of 64 per cent and specificity of 70 per cent [area under the ROC curve (AUC) 0.70±0.088, P<0.05, 95 per cent confidence interval (CI) 0.527-0.873], cut-off for per cent CD34+ B-cell progenitors was ≤5 per cent with sensitivity of 76 per cent and specificity of 100 per cent (AUC 0.852±0.001, P<0.05, 95% CI 0.723-0.981) and cut-off for per cent CD34+ myeloblasts was ≥1 per cent with sensitivity of 68 per cent and specificity of 90 per cent (AUC 0.818±0.76, P<0.05, 95% CI 0.668-0.968) for the diagnosis of MDS. ROC analysis for the above three parameters is depicted in Figure 1. Ly/Mbl CD45 ratio showed a Gaussian distribution and reference range was calculated using mean±2SD as 4.51-7.96. In proven MDS, decrease in per cent CD34+ B-cell progenitors (20/26, 76.9%) was the most common aberrancy followed by increase in per cent CD34+ myeloblasts (18/26, 69.2%), decrease in Gra/Ly SSC ratio (16/26 cases, 61.5%) and abnormal Ly/Mbl CD45 ratio (15/26, 57.6%). On analysis of LG-MDS (RCMD, 5q-, MDS-U and hypoplastic MDS), a decrease in per cent CD34+ B-cell progenitors, abnormal Ly/Mbl CD45 ratio, increase in per cent CD34+ myeloblasts and decreased Gra/Ly SSC ratio were seen in 61.5 (8/13), 61.5 (8/13), 53.8 (7/13) and 38.4 per cent (5/13) patients, respectively. The same parameters were abnormal in 38.8 (7/18), 38.8 (7/18), 38.8 (7/18) and 33.3 per cent (6/18) patients with suspected MDS, respectively.
![Receiver operator characteristic (ROC) curve of (A) granulocyte:lymphocyte SSC ratio [cut-off ≤6.1 (AUC 0.7±0.088, P<0.05)]; (B) %CD34+ B-cell progenitors of the total CD34+ cells [cut-off ≤5% (AUC 0.85±0.001, P<0.05)]; (C) %CD34-positive myeloblasts of the total nucleated cells [cut-off ≥1% (AUC 0.818±0.76, P<0.05)].](/content/175/2020/152/3/img/IJMR-152-254-g001.png)
- Receiver operator characteristic (ROC) curve of (A) granulocyte:lymphocyte SSC ratio [cut-off ≤6.1 (AUC 0.7±0.088, P<0.05)]; (B) %CD34+ B-cell progenitors of the total CD34+ cells [cut-off ≤5% (AUC 0.85±0.001, P<0.05)]; (C) %CD34-positive myeloblasts of the total nucleated cells [cut-off ≥1% (AUC 0.818±0.76, P<0.05)].
Aberrant antigen expression and pattern analysis: Frequency of various aberrant antigen expression and pattern abnormalities in proven and suspected MDS patients are shown in Table I. All five patients with proven MDS with aberrant expression of CD5 and CD7 were at a high risk on R-IPSS. On granulocytes, aberrant pattern of CD13/CD11b was the most common abnormality. None of the patients showed aberrant CD19 on granulocytes.
| Aberrant expression pattern | Proven MDS (n=26) | Suspected MDS (n=18) | ||||
|---|---|---|---|---|---|---|
| Myeloblasts n (%) | Maturing granulocytes n (%) | Monocytes n (%) | Myeloblasts n (%) | Maturing granulocytes n (%) | Monocytes n (%) | |
| Aberrant expression of CD56 | 7 (26.9) | 13 (50) | 14 (53.8) | 0 | 4 (22) | 7 (38.8) |
| Aberrant expression of CD5 | 2 (7.6) | 1 (3.8) | 1 (3.8) | 1 (5.5) | 0 | 0 |
| Aberrant expression of CD7 | 1 (3.8) | 0 | 0 | 1 (5.5) | 1 (5.5) | 1 (5.5) |
| Asynchronous expression of CD34 | - | 1 (3.8) | 2 (7.6) | - | 0 | 0 |
| Decreased expression of CD10 | - | 7 (26.9) | - | - | 6 (33.3) | - |
| Increased expression of HLA-DR | - | 9 (34.6) | - | - | 4 (21.3) | - |
| Decreased expression of HLA-DR | - | - | 7 (26.9) | - | - | 1 (5.55) |
| Decreased expression of CD11b | - | - | 10 (38.4) | - | - | 5 (27.7) |
| Aberrant pattern of CD13/CD11b | - | 21 (80.7) | - | - | 6 (33.3) | - |
| Aberrant pattern of CD11b/CD16 | - | 18 (69.2) | 16 (61.5) | - | 5 (27.7) | 6 (33.3) |
| Aberrant pattern of CD13/CD16 | - | 18 (69.2) | - | - | 6 (33.3) | - |
| Aberrant pattern of HLA-DR/CD11b | - | 8 (30.7) | 14 (53.8) | - | 5 (27.7) | 4 (22.2) |
Flow scores in proven myelodysplastic syndromes (MDS): Ogata mini-panel showed a score of zero in one of 26 patients, score of one in four, score of two in 21, score of three in 16 and a score of four in seven patients. Ogata score ≥2 could correctly diagnose
80.7 per cent (21/26) of proven MDS. On applying aberrant antigen expression and pattern analysis and flow score of ≥3, 92.3 per cent (24/26) of proven MDS could be diagnosed correctly. Most patients who could not be diagnosed by Ogata score or pattern score were LG-MDS cases as shown in Table II. Combination of both scores and flow score ≥3 as per ELN guidelines could diagnose 100 per cent (26/26) cases.
| MDS subtype | Ogata mini-panel (A) score ≥2 (%) | Pattern analysis (B) score ≥3 (%) | Combining A+B and flow score ≥3 (%) |
|---|---|---|---|
| RCMD | 4/8 (50) | 7/8 (87.5) | 8/8 (100) |
| RAEB-1 | 4/4 (100) | 4/4 (100) | 4/4 (100) |
| RAEB-2 | 8/9 (89) | 9/9 (100) | 9/9 (100) |
| MDS-U | 1/1 (100) | 1/1 (100) | 1/1 (100) |
| 5q-syndrome | 2/2 (100) | 1/2 (50) | 2/2 (100) |
| Hypoplastic MDS | 2/2 (100) | 2/2 (100) | 2/2 (100) |
| Total | 21/26 (80.7) | 24/26 (92.3) | 26/26 (100) |
RCMD, refractory cytopenia with multilineage dysplasia; RAEB-1, refractory anaemia with excess blasts-1; RAEB-2, refractory anaemia with excess blasts-2; MDS-U, MDS-unclassifiable
Flow scores in suspected MDS: Median follow up was 14.5 months (3-21 months). Of the 18 patients suspected to have MDS, two were excluded due to lack of follow up. On applying combination approach (Ogata+Pattern), combined score ≥3 was present in 56.2 per cent (9/16). Probable diagnosis of suspected MDS patients using a combined Pattern and Ogata score (combined flow score) is shown in Figure 2. Ogata score ≥2 was present in 37.5 per cent (6/16). On applying aberrant antigen expression and pattern analysis, pattern score ≥3 was present in 43.7 per cent (7/16).
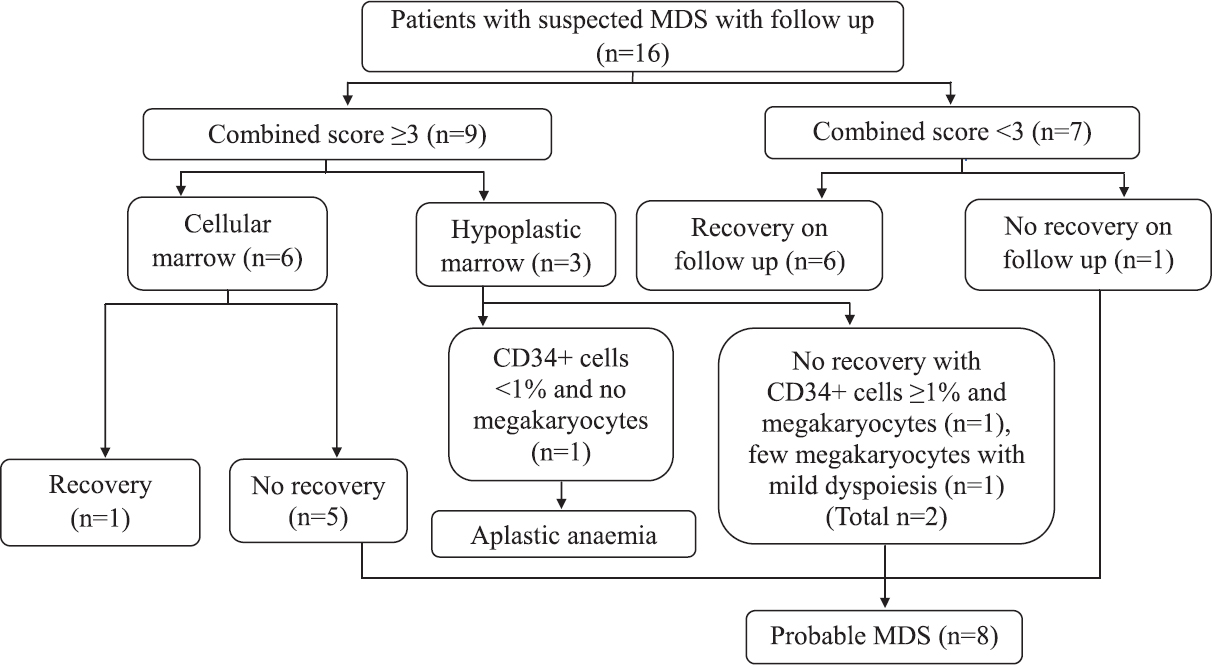
- Flow chart showing follow up and diagnosis of patients with suspected myelodysplastic syndrome (MDS).
Eight patients with persistent cytopenia were labelled as probable MDS. Ogata score ≥2 was present in 5/8 (62.5%), pattern score ≥3 was present in 6/8 (75%), combined score ≥3 (Ogata+Pattern) was present in 7/8 (87.5%) patients with probable MDS.
Analysis of combined proven and probable MDS patients: Using Ogata mini-panel score ≥2, 76.4 per cent (26/34) proven and probable MDS cases could be diagnosed while applying only pattern score ≥3 could diagnose 88.2 per cent (30/34) proven and probable MDS cases. Combined score (Ogata+Pattern) improved the diagnostic ability to 97 per cent (33/34).
When we looked at LG-MDS including 13 proven (RCMD, 5q-, MDS-U and hypoplastic MDS) and eight probable MDS patients, Ogata score, pattern analysis score and combined score could diagnose 66.7 per cent (14/21), 80.9 per cent (17/21) and 95.2 per cent (20/21) cases correctly, respectively.
Sensitivity, specificity and likelihood ratio of different scores: Sensitivity, specificity and likelihood ratio were calculated considering probable MDS patients as LG-MDS. Sensitivity, specificity and likelihood ratio of different scores are given in Table III. For Ogata score in LG-MDS, true positives (TP) were considered as nine patients with proven and five with probable MDS. False negatives (FN) were four patients with proven MDS and three with probable MDS where the Ogata score was <2 but the counts did not recover. There was one false positive (FP) patient with suspected MDS case in whom counts recovered. The true negatives (TN) were 10 controls and 6 suspected MDS who recovered their counts and an additional patient diagnosed as aplastic anaemia on BM biopsy. When Ogata score in all suspected MDS patients was considered, TP were 21 proven and 5 probable MDS cases who did not recover their counts and Ogata score was ≥2. FP was one patient with suspected MDS who recovered his counts. Five proven and three probable MDS patients had Ogata score <2 and were taken as FN. Ten controls and the six suspected MDS patients were TNs who recovered their counts and an additional patient diagnosed as aplastic anaemia.
| Score | MDS type | Sensitivity (%) | Specificity (%) | Likelihood ratio for positive results |
|---|---|---|---|---|
| Ogata score | Low-grade (LG)-MDS (n=21) | 66.6 | 94.4 | 11.89 |
| All clinically suspected MDS (n=44) | 76.4 | 94.4 | 13.64 | |
| Aberrant antigen and pattern analysis score | LG-MDS (n=21) | 80.9 | 94.4 | 14.4 |
| All clinically suspected MDS (n=44) | 88.2 | 94.4 | 15.75 | |
| Combined score | LG-MDS (n=21) | 95.2 | 88.8 | 8.5 |
| All clinically suspected MDS (n=44) | 97 | 88.8 | 8.6 |
For pattern score in LG-MDS, TP were 11 proven and six probable MDS patients and FN were two patients with proven and one probable MDS. One patient diagnosed as aplastic anaemia was FP as the pattern score was 4. TNs were 10 controls and seven suspected MDS with pattern score <3 and complete count recovery. For pattern score in all suspected MDS patients, TP were 24 proven and six probable MDS patients. FNs were two proven and two probable MDS patients. FP and TN were the same as the pattern score in LG-MDS.
When combined score was considered in LG-MDS, TPs were 13 proven and seven probable MDS and TN was only a single case of probable MDS in whom the score was <3 but the counts did not recover. There were two FPs including a patient of suspected MDS with a score of 3 but complete count recovery on follow up and a patient of aplastic anaemia with a score of 5. TNs were 10 controls and six suspected MDS where complete count recovery occurred and flow score was <3. Assessing combined score in all clinically suspected cases, 26 patients with proven and seven with probable MDS were TPs where counts did not recover. FP and TN were the same as for LG-MDS.
Revised international prognostic scoring system (R-IPSS) and its correlation with flow scores: R-IPSS could be applied in 22 of 26 patients with proven MDS. Frequency in various risk categories were - very high risk (26.9%), high risk (11.5%), intermediate risk (19.2%), low risk (26.9%) and none of the patients was in the very low risk category. There was a positive correlation between R-IPSS and Ogata score (r=0.436, P=0.043), R-IPSS score and pattern analysis (r=0.456, P=0.033) and combination of both approaches also showed a positive correlation with R-IPSS score (r=0.486, P=0.022).
Of the eight patients with probable MDS, cytogenetics was not available in two. R-IPSS of the remaining patients was low risk in five and very low risk in one. Spearman's correlation of R-IPSS with Ogata score, pattern analysis score and combined flow score was done in total cases of MDS diagnosed (i.e. proven MDS and probable MDS). There was positive correlation with Ogata score (r=0.383, P=0.048), pattern analysis score (r=0.512, P=0.006) and combined flow score (r=0.522, P=0.005).
Discussion
Diagnosis of MDS becomes difficult in LG-MDS without RS in the absence of CCA because of inter-observer variability to identify dyspoiesis. Many studies have been done for the use of FCM as a diagnostic modality in MDS141617181920. Attempts have been made by the ELN Working Group for FCM in MDS to standardize FCM for the diagnosis of MDS21222425.
Most studies have used flow scores based on either Ogata mini-panel or aberrant antigen expression and pattern analysis to diagnose MDS131415161726 We tried to use a combined approach of assessing both the Ogata mini-panel and pattern and antigen aberrancy analysis in this study. Cut-offs calculated for Ogata mini-panel were similar to those used in studies by Della Porta et al26 and Ogata et al14 except per cent CD34+ myeloblasts which was two per cent in their studies while it was one per cent in the present study.
It has been documented that decreased per cent CD34+ B-cell progenitors and increased per cent CD34+ myeloblast are common quantitative abnormalities131517. In the present study, a decrease in per cent CD34+ B-cell progenitors was seen in 76.9 per cent proven MDS cases. Our study showed an increase in per cent CD34+ myeloblasts in 69.2 per cent proven MDS cases and 38.8 per cent suspected MDS cases. Chopra et al17 earlier showed increased per cent CD34+ myeloblasts in 71.2 per cent proven MDS cases and in none of the suspected MDS cases. This could be because their cut-off for blast was >3 per cent and most of the suspected MDS patients belonged to LG-MDS while in our study, the cut-off determined by the ROC analysis was >1 per cent. In MDS as the disease advances, per cent CD34+ myeloblasts increase and the per cent CD34+ B-cell progenitors and granulocyte:lymphocyte SSC ratios decrease15. In the present study also similar findings were observed.
Ogata score could correctly diagnose 80.7 per cent proven MDS and 69.2 per cent LG proven MDS cases. Our results were similar to a previous study in which an Ogata score ≥2 was seen in 70.4 per cent LG-MDS cases in the learning cohort and 69.1 per cent in the validation cohort27 and a study by Ogata et al14 who could correctly classify 61.1 per cent LG-MDS cases.
Demonstration of aberrant antigen expression and pattern analysis is a sensitive objective method to differentiate MDS from non-MDS cases1720. Abnormal CD13/CD16 pattern was the most common abnormality similar to most of other studies121619. In the present study, aberrant antigen expression and pattern flow score ≥3 correctly diagnosed 92.3 per cent proven MDS and 84.6 per cent LG proven MDS. Our results were similar to Chopra et al17 who could correctly diagnose 84.6 per cent probable MDS cases but were in variance to that of Kern et al16 who could diagnose only 17.7 per cent probable MDS cases.
In our study using combined approach with flow score ≥3, 100 per cent patients with proven MDS were diagnosed despite the fact that we used about 56 per cent of the non-erythroid aberrancies recommended by ELN 2014 guidelines22. Even in the suspected MDS, combined approach could correctly diagnose 87.5 per cent probable MDS. Thus combination of Ogata mini-panel and pattern analysis was found to be better. We also evaluated the proven MDS patients using flow score ≥4 and ≥5. Using flow score ≥4 excluded one case of RCMD and flow score ≥5 excluded another case of MDS with del(5q). Hence, with our panel, a flow score of ≥3 was recommended.
Aberrant expression of CD56 on granulocytes and monocytes is also found in haematopoiesis regeneration, activation and inflammatory responses21. Although aberrant CD56 was common in our study, we evaluated our patients after exclusion of this abnormality. Using a flow score of ≥3 in >1 lineage, none of our patients with proven MDS would have been excluded if CD56 data were not included. In the present study, aberrant CD5 and CD7 expression on myeloblasts, maturing granulocytes and monocytes was seen in 7.6, 3.8 and 3.8 per cent and 3.8, 0 and 0 per cent cases, respectively. Similar low percentages were reported earlier1627 limiting their usefulness in diagnosis of MDS.
Kern et al16 have shown that number of FCM abnormalities increase with increasing IPSS scores. In another study, increased aberrancies on FCM was associated with poor overall survival28. As R-IPSS is a better prognostic indicator29, we evaluated the correlation of flow scores and R-IPSS. A positive correlation was found between R-IPSS and all the three scores i.e. Ogata score, pattern analysis score and combined score.
The major limitation of our study was the small sample size due to low incidence of disease and short duration of study. Another limitation was that assessment of erythroid dysplasia although recommended by ELN guidelines could not be done. Despite best efforts to obtain repeat bone marrow samples from patients with suspected MDS, the follow up marrows were not available to see whether flow abnormalities persisted or increased along with increasing dysplasia and acquisition of new cytogenetic abnormalities. A correlation with treatment outcomes was not possible as the multiple approaches to therapy were used.
FCM is recommended to be reported integrated with morphology and cytogenetics24. However, FCM has a very important role in diagnosis of LG-MDS with persistent cytopenia, minimal dyspoiesis on cytomorphology and no CCA as many of these patients later develop full-blown MDS30.
In conclusion, our findings show a combined approach of Ogata and pattern and aberrant antigen analysis with demonstration of ≥3 aberrancies in >1 cell compartment i.e. myeloblasts, B-cell progenitors, maturing myeloid cells and monocytes can diagnose most MDS cases. Patients with high flow scores have high R-IPSS scores and hence likely to have poor prognosis. It is suggested that FCM be carried out in all cases suspected as MDS. Patients who do not meet the morphology and cytogenetic diagnostic criteria of MDS but have a flow score ≥3 should be followed up closely as these are at a high risk of developing MDS.
Financial support & sponsorship: None.
Conflicts of Interest: None.
References
- Incidence and burden of the myelodysplastic syndromes. Curr HematolMalig Rep. 2015;10:272-81.
- [Google Scholar]
- Incidence of haematological malignancy by sub-type: A report from the haematological malignancy research network. Br J Cancer. 2011;105:1684-92.
- [Google Scholar]
- Characteristics of US patients with myelodysplastic syndromes: Results of six cross-sectional physician surveys. J Natl Cancer Inst. 2008;100:1542-51.
- [Google Scholar]
- Clinical presentation, diagnosis, and prognosis of myelodysplastic syndromes. Am J Med. 2012;125:S6-13.
- [Google Scholar]
- An analysis of 30 cases of myelodysplastic syndrome. Indian J Pathol Microbiol. 2009;52:206-9.
- [Google Scholar]
- Cytogenetic profile of Indian patients with de novo myelodysplastic syndromes. Indian J Med Res. 2011;134:452-7.
- [Google Scholar]
- Cytogenetic study of myelodysplastic syndrome from India. Indian J Med Res. 2009;130:155-9.
- [Google Scholar]
- Diagnostic flow cytometry for low-grade myelodysplastic syndromes. Hematol Oncol. 2008;26:193-8.
- [Google Scholar]
- Groupe d'Etude Immunologique des Leucémies (GEIL). Immunophenotypic clustering of myelodysplastic syndromes. Blood. 2002;100:2349-56.
- [Google Scholar]
- Abnormal patterns of expression of CD16 (FcR-III) and CD11b (CRIII) antigens by developing neutrophils in the bone marrow of patients with myelodysplastic syndrome. Lab Hematol. 1997;3:292-8.
- [Google Scholar]
- Diagnostic utility of flow cytometric immunophenotyping in myelodysplastic syndrome. Blood. 2001;98:979-87.
- [Google Scholar]
- Diagnostic application of flow cytometric characteristics of CD34+ cells in low-grade myelodysplastic syndromes. Blood. 2006;108:1037-44.
- [Google Scholar]
- Diagnostic utility of flow cytometry in low-grade myelodysplastic syndromes: A prospective validation study. Haematologica. 2009;94:1066-74.
- [Google Scholar]
- Differences in blast immunophenotypes among disease types in myelodysplastic syndromes: A multicenter validation study. Leuk Res. 2012;36:1229-36.
- [Google Scholar]
- Clinical utility of multiparameter flow cytometry in the diagnosis of 1013 patients with suspected myelodysplastic syndrome: Correlation to cytomorphology, cytogenetics, and clinical data. Cancer. 2010;116:4549-63.
- [Google Scholar]
- Flow cytometry in myelodysplastic syndrome: Analysis of diagnostic utility using maturation pattern-based and quantitative approaches. Ann Hematol. 2012;91:1351-62.
- [Google Scholar]
- Clinical significance of phenotypic features of blasts in patients with myelodysplastic syndrome. Blood. 2002;100:3887-96.
- [Google Scholar]
- Improving the differential diagnosis between myelodysplastic syndromes and reactive peripheral cytopenias by multiparametric flow cytometry: The role of B-cell precursors. Diagn Pathol. 2015;10:44.
- [Google Scholar]
- Myeloid and monocytic dyspoiesis as determined by flow cytometric scoring in myelodysplastic syndrome correlates with the IPSS and with outcome after hematopoietic stem cell transplantation. Blood. 2003;102:394-403.
- [Google Scholar]
- Standardization of flow cytometry in myelodysplastic syndromes: A report from an international consortium and the European Leukemia Net Working Group. Leukemia. 2012;26:1730-41.
- [Google Scholar]
- Revisiting guidelines for integration of flow cytometry results in the WHO classification of myelodysplastic syndromes-proposal from the International/European Leukemia Net Working Group for flow cytometry in MDS. Leukemia. 2014;28:1793-8.
- [Google Scholar]
- Myelodysplastic syndromes/neoplasms, overview. In: Swerdlow SH, Campo E, Harris NL, Jaffe ES, Pileri SA, Stein H, eds. WHO classification of tumours of haematopoietic and lymphoid tissues. Lyon: IARC; 2008. p. :88-93.
- [Google Scholar]
- Standardization of flow cytometry in myelodysplastic syndromes: Report from the first European Leukemia Net Working Conference on flow cytometry in myelodysplastic syndromes. Haematologica. 2009;94:1124-34.
- [Google Scholar]
- Rationale for the clinical application of flow cytometry in patients with myelodysplastic syndromes: Position paper of an International Consortium and the European Leukemia Net Working group. Leuk Lymphoma. 2013;54:472-5.
- [Google Scholar]
- Multicenter validation of a reproducible flow cytometric score for the diagnosis of low-grade myelodysplastic syndromes: Results of a European Leukemia net study. Haematologica. 2012;97:1209-17.
- [Google Scholar]
- Multicentric study underlining the interest of adding CD5, CD7 and CD56 expression assessment to the flow cytometric Ogata score in myelodysplastic syndromes and myelodysplastic/myeloproliferative neoplasms. Haematologica. 2015;100:472-8.
- [Google Scholar]
- Multiparameter flow cytometry provides independent prognostic information in patients with suspected myelodysplastic syndromes: A study on 804 patients. Cytometry B Clin Cytom. 2015;88:154-64.
- [Google Scholar]
- Revised International Prognostic Scoring System (IPSS) predicts survival and leukemic evolution of myelodysplastic syndromes significantly better than IPSS and WHO Prognostic Scoring System: Validation by the Gruppo Romano Mielodisplasie Italian Regional Database. J Clin Oncol. 2013;31:2671-7.
- [Google Scholar]
- Serial assessment of suspected myelodysplastic syndromes: Significance of flow cytometric findings validated by cytomorphology, cytogenetics, and molecular genetics. Haematologica. 2013;98:201-7.
- [Google Scholar]


