
Translate this page into:
Prevalence of substance use disorders in Punjab: Findings from National Mental Health Survey
For correspondence: Dr B.S. Chavan, Department of Psychiatry, Government Medical College & Hospital, Chandigarh 160 030, India e-mail: drchavanbs@gmail.com
-
Received: ,
This is an open access journal, and articles are distributed under the terms of the Creative Commons Attribution-NonCommercial-ShareAlike 4.0 License, which allows others to remix, tweak, and build upon the work non-commercially, as long as appropriate credit is given and the new creations are licensed under the identical terms.
This article was originally published by Wolters Kluwer - Medknow and was migrated to Scientific Scholar after the change of Publisher.
Abstract
Background & objectives:
Substance use disorders are a major public health concern in Punjab. However, reliable estimates of prevalence of substance use disorders are not available for the State. The present study reports estimates of prevalence of substance use disorders in Punjab, conducted as part of National Mental Health Survey, India.
Methods:
Using multistage stratified random cluster sampling, 2895 individuals from 719 households of 60 clusters (from 4 districts of Punjab) were interviewed. Mini International Neuropsychiatric Interview and Fagerstrom nicotine dependence scale were used to assess substance use disorders.
Results:
The sample comprised almost equal numbers of males and females. Nearly 80 per cent had less than or equal to high school education, and 70 per cent were married. The weighted prevalence of alcohol and other substance use disorders was 7.9 and 2.48 per cent, respectively. The prevalence of tobacco dependence was 5.5 per cent; 35 per cent households had one person with substance use disorder. The prevalence was highest in the productive age group (30-39 yr), urban metro and less educated persons. The prevalence of alcohol and other substance use disorders was much higher in Punjab as compared to other States where survey was done. Tobacco dependence was lowest in Punjab. Majority (87%) of the persons with substance use disorders did not suffer from any other mental disorder. Treatment gap was 80 per cent.
Interpretation & conclusions:
Punjab has a high burden of substance use disorders. The estimates will help clinicians and policymakers to plan the strategies against the menace of substance use disorders effectively.
Keywords
Alcohol
opioids
prevalence
Punjab
substance use disorders
tobacco
treatment gap

Globally, alcohol use was the 7th leading risk factor for deaths and disability adjusted life years (DALYs) in 2016, accounting for 2.2 per cent and 6.8 per cent of age standardized female and male deaths, respectively1. According to the WHO, 2.1 per cent persons in India above 15 yr have alcohol dependence (3.8% among males and 0.4% among females)2. Substance use disorders cause tremendous burden on the individual, family and community as a whole. These have become a major public health concern in Punjab (a north Indian State), and the situation is likely to worsen in the absence of appropriate interventions3.
Reliable estimates of prevalence of substance use disorders are not available for Punjab. A previous survey rated Punjab as a region with high opiate use4. In the last three decades, several studies on the prevalence of substance use have been carried out in Punjab567891011121314. However, the majority of these studies had methodological limitations in terms of that these were carried out at single site713, single district81213 or only in border villages6910. These studies differ in terms of sample sizes, methodology, case definition and screening/diagnostic instrument used which inhibit extrapolation of their results to other States567891011. As part of National Family Health Survey in Punjab, information on alcohol and tobacco use is available. However, data on their harmful use/dependence and other substances of abuse are not available14.
Studies on the prevalence of substance use disorders are lacking at the national level also15. An earlier meta-analysis of 13 epidemiological studies reported that only five studies assessed alcohol/drug addiction and the prevalence of alcohol/drug addiction was 6.9 per cent16. Only a few studies have been conducted in other parts of India17181920. However, findings from other States cannot be generalized to Punjab because substance use is affected by multiple socio-cultural and environmental factors, which are important in initiation, maintenance and treatment of substance use disorders. The present survey was a part of the National Mental Health Survey (NMHS)2122 conducted in 12 States of India including Punjab. The major aim was to obtain estimates of prevalence of mental and substance use disorders and provide information to plan and develop mental health services.
Material & Methods
This study was conducted by the department of Psychiatry, Government Medical College and Hospital (GMCH), Chandigarh, and coordinated by National Institute of Mental Health and Neurosciences (NIMHANS), Bengaluru, India. This multisite cross-sectional study was conducted in four randomly selected districts of the State during October 2015 - March 2016. Since the survey in Punjab was part of the NMHS, the sample size for the State was calculated by the coordinating centre (NIMHANS) based on the results of the pilot study conducted in Kolar district of Karnataka2122. Consequently, at the prevalence rate of any mental morbidity of 7.5 per cent, absolute precision of two per cent, 95 per cent confidence level, design effect of three and non-response rate of 30 per cent, the estimated sample size was 2857 rounded off to 3000.
The study was approved by the Institutional Ethics Committee of NIMHANS, Bengaluru (the coordinating centre for NMHS), and further by the ethics committee of GMCH, Chandigarh (responsible for conducting the survey in Punjab). The details of the survey procedure were explained to all the participants before the interview. Written informed consent was obtained from each interviewed individual.
Study design: The overall study design (Fig. 1) was multistage, stratified, random cluster sampling technique with random selection based on probability proportion to size at each stage. To have representative sample, the number of clusters chosen was in proportion to rural, urban metro and urban non-metro population in the State as per the Census 201123. The districts, community development blocks and households were the primary, secondary and final sampling units, respectively. Individuals within the identified households were the units of analysis. Since there is a close relation of mental disorders with socio-economic status, all the districts of Punjab were stratified on the basis of district-level poverty estimates into three strata. One district was randomly selected from each stratum, and two community development blocks/taluks were selected from each district. From each tehsil/taluk, nine clusters (6 rural and 3 urban non-metro) were randomly selected. The three districts randomly selected using this technique were Faridkot, Moga and Patiala. Since there was no urban metro area within the selected districts, six urban metro clusters were selected from Ludhiana. Within the clusters, households were selected by systematic random sampling following random selection of the first household.
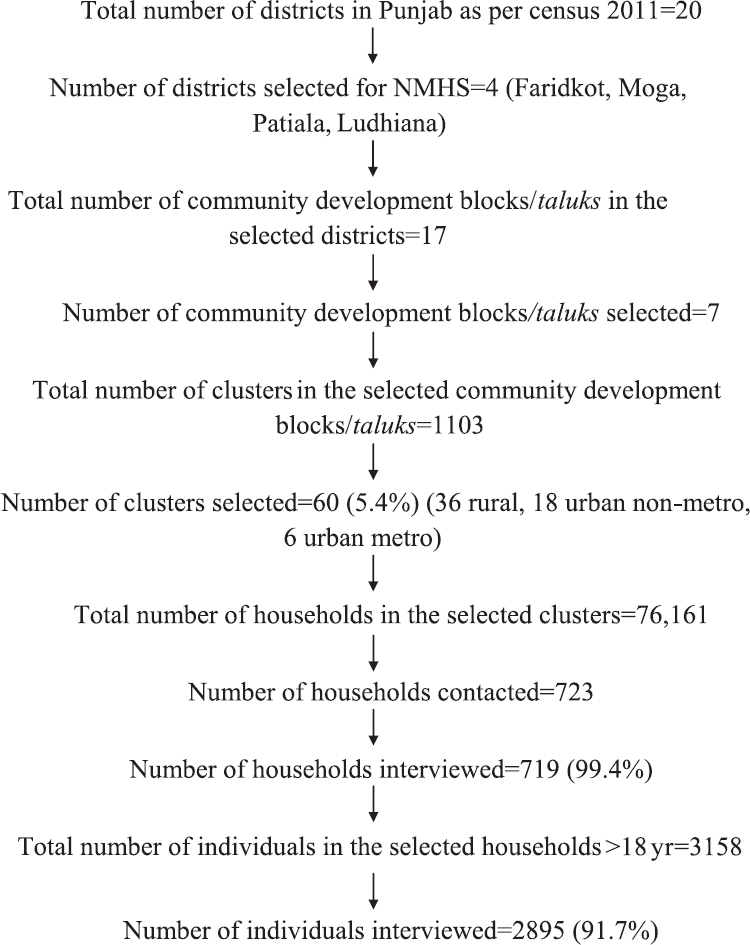
- Study design for National Mental Health Survey (NMHS) in Punjab.
In addition to the household survey, exploratory focussed group discussions (FGDs) were conducted to understand the community perceptions regarding substance use disorders. Five FGDs each were conducted among general public and healthcare professionals in the community.
Selection of respondents: After locating the household for survey, a responsible respondent (a responsible respondent was an adult of the household, preferably but not necessarily head of the household who was aware of all the other members) was identified and a list of all members was made. All members above 18 yr were eligible and needed to be interviewed in each family. When the eligible respondent was available, interview was conducted. In case an individual was not available, two more visits were planned. The individual was declared as a non-responder if he/she was not available even after three visits.
Exclusion criteria: Family members staying away from the household due to any reason were excluded. Abandoned non-residential buildings, uninhabited houses, commercial establishments, temporary settlements, hostels and postgraduate accommodations were also excluded. Refusal to give consent and be interviewed was other exclusion criteria.
Study instruments
General information and socio-demographic details: The socio-demographic information (relation to the head of family, age, gender, education, occupation, income and marital status) of each family member was collected. Cluster type (rural, urban, urban-metro) and income of the family were also recorded.
Mini International Neuropsychiatric Interview version 6 (MINI): Mini International Neuropsychiatric Interview version 6 (MINI)24 is a structured diagnostic interview schedule for screening and diagnosing mental disorders. It comprises closed-ended questions and provides International Classification of Diseases-10 (ICD-10) compatible diagnosis of mental illnesses and substance use disorders (dependence and harmful use) with reference to alcohol and illicit drugs. MINI does not assess current or ever use of substances, and the focus is to identify individuals with substance use disorders who are in need of treatment interventions. Individuals who are either dependent or having harmful use of alcohol or illicit drugs (such as opioids, cannabinoids, sedatives, hypnotics, hallucinogens and solvents) are considered to have 'alcohol use disorder' or 'other substance use disorder', respectively. MINI does not include questions regarding tobacco use.
Fagerstrom nicotine dependence scale (FNDS): The tool to assess tobacco dependence was an expansion and adaptation of Fagerstrom nicotine dependence scale (FNDS)25. All the questions of the scale and its scoring system were retained and were used to identify nicotine dependence among tobacco users (smoking and smokeless)22. A few questions were added to categorize tobacco users. Individuals found to have dependence on this scale were termed to have 'tobacco use disorder' which was further categorized as mild, moderate and significant dependence. The category of 'any substance use disorder' included individuals who were positive for either 'alcohol use disorder' or 'tobacco use disorder' or 'other substance use disorder'.
Treatment gap: The Pathways Interview Schedule of the WHO26 was adapted for the survey to study health-seeking patterns and treatment gap. It was applied on persons identified to be suffering from substance use disorders on MINI and FNDS21. Treatment gap is defined as percentage of persons who have a disorder but are not taking treatment.
Translation of the instruments: All the study instruments were reviewed for their appropriateness and translated to Punjabi language. They were reviewed by the individual State collaborators and back-translated to English, checked for discrepancy in wording and phrases to ensure that the differences between the original and back-translated version were not significant. The study instruments were loaded onto handheld device (Dell Venue 8 Pro 5000 Series 32 GB Windows 8.1, Dell Inc., Texas, United States) and were subsequently used for data collection.
Quality assurance: The investigators from Punjab State team received four days of intensive training on various aspects of the survey from the coordinating centre (NIMHANS). The field data collectors (FDCs) were also extensively trained for two months before the data collection started.
A robust three-tier field-level, State-level and national-level monitoring mechanism was put in place for smooth conduct of the survey and for ensuring quality of the data collected. Field-level monitoring included daily monitoring by a field study coordinator. Weekly and monthly review meetings (over phone, on site, video conferencing) were conducted by the investigators to assess the quality of data collected and to provide refresher training as and when needed. Five per cent re-interviews were also conducted together by the study investigators and FDC supervisor, and Cohen's kappa was used to measure the reliability of diagnosis by measuring the agreement between the interviews and re-interviews. The overall agreement between the interviews and re-interviews was found to be fair (kappa 0.4). However, it must be noted here that this agreement was for overall mental morbidity and not exclusively for substance use disorder, and therefore, several factors such as variations in the time gap between interviews and re-interviews (it should be noted here that common mental disorders were more prevalent in the study population, and hence, time gap between interview and re-interview was important), nature and severity of the disorders under consideration, recall bias, problems with repeated interviewing (fatigability, loss of interest, forgetting, rumination bias) especially associated with mental health surveys influenced the kappa value.
Statistical analysis: The data collected by the State team were sent to the coordinating centre (NIMHANS) for error checks and cleaning the data. The final edited data set was used for analysis. The present survey employed multistage stratified random cluster sampling technique, and therefore, to increase the representativeness of the sample by neutralizing/adjusting the sampled data for unequal probabilities of selection and accommodating differential non-response rates, sampling weights were used. Design weights were calculated by considering the probability of selection of districts, taluks and the individual non-response rate. Data were summarized as frequencies and proportions. All estimates are presented with 95 per cent confidence intervals. Multiple logistic regression analysis was conducted to identify factors independently associated with substance use disorders. Data analysis was undertaken using the software package 'SPSS version 22' (IBM Corp. Released 2013. IBM SPSS Statistics for Windows, Version 22.0. Armonk, NY: IBM Corp.USA).
Results
The survey was carried out in 60 clusters where 3158 eligible members above 18 yr of age were enlisted, and of them, 2895 could be interviewed (response rate 91.7%) in 719 households (response rate 99.4%). Of the 2895 persons, there were 1464 (50.56%) males and 1431 (49.43%) females and more than 30 per cent respondents were between 18 and 29 yr of age. Nearly 60 per cent individuals were residing in the rural areas, 80 per cent had less than or equal to high school education and 70 per cent were married.
Of the 719 households interviewed, 34.91 per cent households (251 of 719) had at least one person suffering from any substance use disorder. The number of households with at least one person suffering from other substance use disorder, alcohol use disorder and tobacco use disorder was 63 (8.76%), 176 (24.47%) and 127 (17.66%), respectively.
The weighted prevalence of alcohol use disorders was 7.90 per cent and of other (illicit) substance use disorders was 2.48 per cent. The prevalence of tobacco use disorder was 5.50 per cent. The weighted prevalence of any substance use disorder (defined as an individual positive for either of the 3 categories) was 11.3 per cent (Table I). Among 7.9 per cent persons with alcohol use disorders, the prevalence of alcohol dependence was 4.8 per cent and harmful use was 3.1 per cent. Similarly, the prevalence of dependence to other (illicit) substances was 1.9 per cent and harmful use of other substances was 0.6 per cent. The prevalence of current tobacco use was 6.5 per cent and 2.0 per cent persons had significant dependence and 3.5 per cent had low-to-moderate dependence. The prevalence of any substance use disorders was much higher in Punjab as compared to the combined prevalence in all 12 States (4.65%)21. The prevalence of other (illicit) substance use disorders was highest in Punjab (weighted prevalence in all 12 States combined was 0.57%) while that of alcohol use disorders was second only to Madhya Pradesh (10.3%)21. The prevalence of tobacco use disorders was lowest in Punjab (weighted prevalence of all 12 States combined was 20.89%) and highest in Rajasthan (38.3%)21. The prevalence of alcohol use disorder was highest among persons aged 30-39 yr followed by persons aged 60 yr and above. The prevalence of other (illicit) substance use disorders was highest among persons aged 30-39 yr followed by 18-29 yr and lowest among persons aged more than 60 yr. Thus, age group of 30-39 yr (most productive age group) bore the maximum brunt of substance use disorders in Punjab (Fig. 2). The prevalence of alcohol, tobacco and other (illicit) substance use disorders was highest among persons residing in the urban metro areas (Fig. 3), among persons who had completed primary- and secondary-level education (as compared to persons with higher education) and among working persons as compared to those who were not working. The prevalence of alcohol use disorder and tobacco dependence was highest among married persons whereas other (illicit) substance use disorders were highest among divorced/widowed/separated. In the multiple logistic regression analysis, risk of any substance use disorder, alcohol use disorder, tobacco use disorder and other substance use disorder was significantly higher among males compared to females. The risk of alcohol use disorder was two times higher among married individuals as compared to never married individuals [odds ratio (OR) 2.18]. Among residents of urban metro areas, the risk of tobacco use disorder was nearly two times higher (OR 1.87) when compared to those residing in rural areas. Elderly persons (OR 0.37) and those having secondary education and above had lower risk of tobacco use disorder. The risk of other (illicit) substance use disorders was three times higher (OR 3.47) among widowed/divorced/separated individuals when compared to never married subjects.
| Characteristics | Alcohol use disorder (95% CI) | Other substance use disorders (95% CI) | Tobacco dependence (95% CI) |
|---|---|---|---|
| Total | 7.9 (7.62-8.19) | 2.48 (2.31-2.64) | 5.5 (5.26-5.75) |
| Gender | |||
| Female | 0.00 | 0.32 (0.23-0.40) | 0.00 |
| Male | 15.6 (15.12-16.20) | 4.60 (4.29-4.91) | 10.91 (10.45-11.38) |
| Education | |||
| Illiterate | 7.2 (6.6-7.7) | 2.5 (2.1-2.9) | 8 (7.4-8.6) |
| Primary | 10.9 (10.1-11.7) | 5 (4.4-5.5) | 9.6 (8.9-10.3) |
| Secondary | 12.1 (11.1-13.0) | 3.3 (2.8-3.8) | 6.9 (6.1-7.6) |
| High school | 6.7 (6.2-7.2) | 1.6 (1.4-1.9) | 3.2 (2.8-3.5) |
| Pre-university/vocational | 3.8 (3.2-4.4) | 0.3 (0.1-0.4) | 0.7 (0.5-1.0) |
| Graduate/postgraduate/professional | 4.4 (3.4-5.4) | 1.1 (0.6-1.6) | 1.1 (0.6-1.6) |
| Not known | 19 (14.3-23.6) | 4.1 (1.7-6.5) | 7.4 (4.3-10.6) |
| Employment | |||
| Working | 15.5 (15.0-6.1) | 4.7 (4.3-5.0) | 10.8 (10.3-11.3) |
| Not working (includes students and housewives) | 2.2 (2.0-2.4) | 0.8 (0.7-1.0) | 1.5 (1.4-1.7) |
| Marital status | |||
| Never married | 6 (5.4-6.5) | 2.3 (2.0-2.7) | 4.8 (4.4-5.3) |
| Married | 8.9 (8.5-9.2) | 2.4 (2.3-2.6) | 5.9 (5.6-6.2) |
| Widowed/divorced/separated | 4.7 (3.9-5.5) | 3.1 (2.5-3.8) | 3.6 (2.9-4.3) |
| Income quintile | |||
| Lowest | 8.4 (7.7-9.0) | 3.4 (3.0-3.8) | 7.6 (6.9-8.2) |
| Second | 7.9 (7.2-8.5) | 3.1 (2.7-3.5) | 5.1 (4.5-5.6) |
| Middle | 10.6 (9.8-11.4) | 2.5 (2.1-2.9) | 6.2 (5.6-6.8) |
| Fourth | 6.2 (5.6-6.7) | 1.8 (1.5-2.1) | 5.3 (4.8-5.8) |
| Highest | 6.9 (6.3-7.5) | 1.7 (1.4-2.0) | 3.6 (3.2-4.1) |
CI, confidence interval
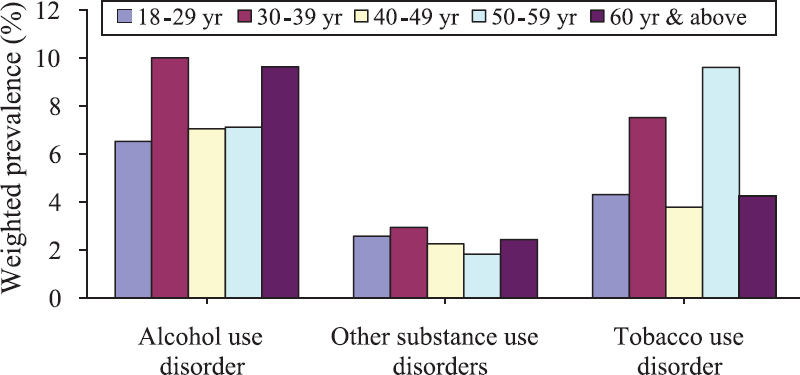
- Age-wise distribution of prevalence (weighted prevalence in %) of substance use disorders.
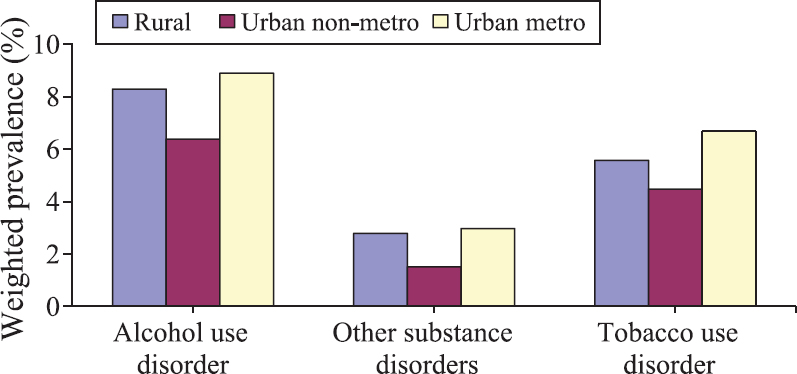
- Place of residence-wise distribution of prevalence (weighted prevalence in %) of substance use disorders.
Only 86 of 2895 persons interviewed reported using 'other (illicit) substances' which included opioids, cannabinoids and benzodiazepines. Of the 86 individuals, nearly 3/4th (73.3%) reported use of only one drug. Of these 86 individuals, 67 (unweighted prevalence 2.3%) were opioid users and 11 (unweighted prevalence 0.4%) were cannabis users. Among opioid users, 18 reported use of only opium and 36 reported use of opioids other than opium. Only three persons reported use of heroin; 87 per cent persons with substance use disorders did not suffer from any other mental disorders. The most common mental disorder among persons with substance use disorders was depression (5.7%), followed by neurotic and stress-related disorders (2.2%) and schizophrenia and other psychotic disorders (1.8%).
The treatment gap for substance use disorders in the study population was 80.9 per cent. It was 81.4 per cent for alcohol, 96.9 per cent for tobacco and 60.0 per cent for other substance use disorders. The treatment gap for alcohol and other substance use disorders was highest among persons aged 50-59 yr. For alcohol use disorder, treatment gap was highest among persons residing in rural areas followed by persons residing in urban non-metro and lowest in urban metro areas. However, the treatment gap for tobacco and other (illicit) substances was highest among urban metro areas followed by rural and urban non-metro areas (Table II).
| Age group | Alcohol use disorder | Tobacco dependence | Other (illicit) substance use disorders |
|---|---|---|---|
| Age (yr) | |||
| 18-29 | 86.9 | 98.4 | 82.1 |
| 30-39 | 79.1 | 89.1 | 78.4 |
| 40-49 | 85.3 | 84.4 | 68.4 |
| 50-59 | 90.1 | 93.9 | 72.8 |
| 60 and above | 75.6 | 89.4 | 84.1 |
| Place of residence | |||
| Rural | 86.5 | 93.4 | 77.4 |
| Urban non-metro | 81.9 | 86.1 | 68.8 |
| Urban metro | 75.0 | 94.4 | 87.5 |
Discussion
Overall, in the State of Punjab, an estimated 10, 80, 974 (as of 2016) individuals above 18 yr of age were in need of de-addiction services with about 7.5 and 2.3 lakh individuals suffering from alcohol use disorder and other (illicit) substance use disorder, respectively2122. As per the ICD 1027, the diagnosis of harmful use requires that actual damage should have been caused to the mental or physical health of the user. Of the 7.9 per cent persons with alcohol use disorder, approximately 40 per cent (3.1% of total) had harmful use. Previous studies from Punjab have reported current use of alcohol in the range of 19-58 per cent67891011121314. However, these studies lacked generalizability because they had variable methodology, sample size, study instruments and case definition and most were single site studies67891011121314. Most of these studies reported only current or ever use of alcohol (limited clinical utility) without information on dependence and/or harmful use.
The current study reported a high prevalence of other (illegal) substance use disorders including opiates, cannabis and other drugs. Hence, early identification and treatment of persons with other (illegal) substance use disorders should be a priority area for the government and health professionals28. The prevalence of tobacco use was lowest in Punjab (5.5% in Punjab vs. 20.89% in the 12 States)21. A previous study from Punjab has noted that religious affiliation was one of the most common reasons for achieving abstinence by persons with substance abuse11. In an indoor detoxification camps in the community, it was noticed that none of the patients smoked during the camp as these camps were held inside the premises of Gurudwara29.
Nearly 35 per cent of the households in Punjab have at least one person with substance use disorder. A previous survey of 1276 households found that the nearly 80 per cent households had one user6. However, this study was done in border districts only6 with trafficking of drugs from the neighbouring countries. The present findings reflected households having persons with problematic substance use disorders (rather than use) and they needed urgent interventions and de-addiction services.
In our study, the prevalence of alcohol use disorder and other substance use disorders was relatively high in the productive population (30-39 yr). This along with a huge treatment gap (81.4% for alcohol use disorder, 96.9% for tobacco use disorder and 60% for other substance use disorders) of substance use disorder observed in the study population may have significant economic impact at the household and societal level. The treatment gap for other substances (mainly opioids), though high, was lesser than alcohol and tobacco. The possible reason for higher treatment gap among persons aged 50-59 yr could be because family and society were more concerned about the health problems among the younger generation, including substance use disorders30. Mental health service utilization rates were found to be lower among elderly than other age groups31. Higher treatment gap in rural areas may be because health services including mental health and de-addiction services in our country are concentrated mainly in the urban areas32. Distance to care, limited or lack of available resources may also lead to higher treatment gap in rural areas. It has also been identified that rural residents have a high need for care threshold before they seek care33.
Majority of the individuals (87%) with substance use disorders did not suffer from any other co-morbid mental disorder. In previous Indian studies, 26-71 per cent patients with substance use disorders were found to suffer from co-morbid depressive disorders and 10-45 per cent from anxiety disorders. However, these studies were conducted on treatment seeking population34. Hence, patients with substance use disorders need to be actively screened for psychiatric disorders for timely diagnosis and management of co-morbid conditions, especially depression.
The study has several strengths: robust methodology, use of valid study instruments translated to Punjabi language, extensive training of data collectors, quality assurance at each level, use of hand held devices for data collection and good response rate. However, despite robust methodology and standard tools, there were some limitations. Due to stigma and many other reasons, under-reporting of substance use disorder could not be ruled out (which is a limitation of all population-based studies). Further, the study did not assess the factors responsible for initiation and maintenance of substance use disorders as this was beyond the scope of the present study. Finally, though validated study instruments were used, the Punjabi version of the same was not previously validated.
In conclusion, the data showed that Punjab had a high burden of alcohol and other (illegal) substance use disorders. Although the above figures were likely to be an underestimate, these were still alarming. Substance use disorders are associated with multiple medical, social, legal, family and marital issues thus causing a huge burden to the individual, family and society. Multipronged and integrated efforts are required to tackle the menace of substance use disorders in Punjab. There is an urgent need to create awareness regarding effective treatment for substance use disorders among the general community.
Acknowledgment
The data used for analysis in this publication are from the National Mental Health Survey (NMHS) of India. As part of NMHS, survey in the State of Punjab was conducted by the departments of Psychiatry and Community Medicine, Government Medical College, Chandigarh and coordinated by National Institute of Mental Health and Neuro Sciences (NIMHANS), Bengaluru. Authors acknowledge the NIMHANS, and its NMHS team, National Technical Advisory Group and National Expert Panel for technical support.
Financial support and sponsorship: The authors acknowledge theMinistry of Health & Family Welfare, Government of India, New Delhi, for financial support.
Conflicts of Interest: None.
References
- Alcohol use and burden for 195 countries and territories, 1990-2016: a systematic analysis for the global burden of disease study 2016. Lancet. 2018;392:1015-35.
- [Google Scholar]
- 2017. Global health observatory data. Geneva: World Health Organization; Available from: http://www.who.int/gho
- Strategy for the management of substance use disorders in the state of Punjab: Developing a structural model of state-level de-addiction services in the health sector (the “Punjab model”) Indian J Psychiatry. 2015;57:9-20.
- [Google Scholar]
- Prevalence of drug abuse in India through a national household survey. Int J Curr Sci. 2015;15:E103-13.
- [Google Scholar]
- Drinking in rural areas: A study in selected villages of Punjab. Ludhiana: Monograph Submitted to Punjab Agricultural University; 1974.
- Patterns and prevalence of opium use in rural Punjab (India) Bull Narc. 1979;31:45-56.
- [Google Scholar]
- Extent and pattern of alcohol use and alcohol-related problems in North India. Indian J Psychiatry. 1980;22:331-7.
- [Google Scholar]
- Drug abuse in a farm community; a brief appraisal of a research work. Drug Alcohol Depend. 1981;7:347-66.
- [Google Scholar]
- A study of drug abuse in rural areas of Punjab (India) Drug Alcohol Depend. 1986;17:57-66.
- [Google Scholar]
- An Epidemiological survey of alcohol and drug dependence in a village of district Sangrur, Punjab. Delhi Psychiatry J. 2011;14:314-22.
- [Google Scholar]
- Drug abuse: Uncovering the burden in rural Punjab. J Family Med Prim Care. 2017;6:558-62.
- [Google Scholar]
- Epidemiological study on drug abusers in rural population of Amritsar (Punjab) Int J Contemp Med Res. 2016;3:3018-20.
- [Google Scholar]
- A review of national health surveys in India. Bull World Health Organ. 2016;94:286-96A.
- [Google Scholar]
- Prevalence of mental and behavioural disorders in India: A meta-analysis. Indian J Psychiatry. 1998;40:149-57.
- [Google Scholar]
- An epidemiological study of drug abuse in urban population of Madhya Pradesh. Indian J Psychiatry. 1996;38:160-5.
- [Google Scholar]
- Prevalence and pattern of alcohol and substance abuse in urban areas of Rohtak city. Indian J Psychiatry. 2002;44:348-52.
- [Google Scholar]
- Suttur study: An epidemiological study of psychiatric disorders in South Indian rural population. Indian J Psychiatry. 2014;56:238-45.
- [Google Scholar]
- National Mental Health Survey of India, 2015-2016: Prevalence, patterns and outcomes. In: NIMHANS publication no. 129. Bengaluru: National Institute of Mental Health and Neuro Sciences; 2016.
- [Google Scholar]
- National mental health survey of India, 2015-2016: Mental health systems. In: NIMHANS Publication no. 130. Bengaluru: National Institute of Mental Health and Neuro Sciences; 2016.
- [Google Scholar]
- Final Population Totals. Available from: http://www.dataforall.org/dashboard/censusinfoindia_pca/
- Reliability and validity of the MINI international neuropsychiatric interview (M.I.N.I.): According to the SCID-P. Eur Psychiatry. 1997;12:232-41.
- [Google Scholar]
- The Fagerstrom Test fo r Nicotine Dependence: a revision of the Fagerstro m Tolerance Questionnaire. Br J Addict. 1991;86:1119-27.
- [Google Scholar]
- Pathways Interview Schedule. Available from: http://apps.who.int/iris/bitstream/10665/61855/1/ MNH_NAT_87.1.pdf
- The ICD – 10 classification of mental and behavioral disorders: Diagnostic criteria for research. Geneva: WHO; 1992.
- National mental health survey: Punjab, 2016-17. Report Submitted to Ministry of Health & Family Welfare, Government of India; 2016-17
- [Google Scholar]
- Treatment of alcohol and drug abuse in CAMP setting. Indian J Psychiatry. 1999;41:140-4.
- [Google Scholar]
- Health problems and health care needs of elderly: Community perspective from a rural setting in India. Int J Community Med Public Health. 2017;4:1213-8.
- [Google Scholar]
- Understanding treatment gaps for mental health, alcohol, and drug use in South Dakota: A qualitative study of rural perspectives. J Rural Health. 2017;33:71-81.
- [Google Scholar]
- A review of Indian research on co-occurring psychiatric disorders and alcohol use disorders. Indian J Psychol Med. 2016;38:10-9.
- [Google Scholar]


