
Translate this page into:
Racial disparities in incidence & survival of Kaposi's sarcoma in the United States
For correspondence: Dr Vivek Kumar, Department of General Internal Medicine, Brigham & Women's Hospital, Harvard Medical School, Boston, USA e-mail: vkumar9@bwh.harvard.edu
-
Received: ,
This is an open access journal, and articles are distributed under the terms of the Creative Commons Attribution-NonCommercial-ShareAlike 4.0 License, which allows others to remix, tweak, and build upon the work non-commercially, as long as appropriate credit is given and the new creations are licensed under the identical terms.
This article was originally published by Wolters Kluwer - Medknow and was migrated to Scientific Scholar after the change of Publisher.
Abstract
Background & objectives:
In the United States (US), Kaposi's sarcoma (KS) is usually seen in the patients affected by human immunodeficiency virus (HIV). The racial differences in the incidence rates and survival of patients with KS have been reported in the US. We undertook this study to analyse the disparities in the race-specific incidence rate and survival of KS patients of two different races in the US based on SEER (Surveillance, Epidemiology and End Results) database.
Methods:
Data on KS patients of African-American (AA) and non-Hispanic White (NHW) races who were diagnosed during 1973-2013 were extracted from SEER database to estimate the incidence rates and survival of KS patients.
Results:
A total of 18,388 NHWs and 3,455 AAs were diagnosed with KS. The age-adjusted incidence rate (AAIR) of KS in patients aged 20-44 yr was 3.8 times higher in AAs than in NHWs. The decline in AAIR of KS among NHWs started during 1989-1994 and preceded decline in the AAIR of AAs. After introduction of highly active antiretroviral therapy (HAART), the incidence continued to decline, but the decrease in the AAIR in AAs [annual percentage change (APC): −6.2; 95% confidence interval (CI): −8.8 to −3.5] was slower than that in NHWs (APC: −10.9; 95% CI: −12.6 to −9.1). The hazard ratio for all-cause mortality in KS patients of the AA race increased from 1.1 (95% CI: 1-1.2) in 1981-1995 to 1.55 (95% CI: 1.4-1.7) in 1996-2013 as compared to those of the NHW race.
Interpretation & conclusions:
Several significant racial disparities that emerged after HAART introduction in the incidence and survival of KS patients continued to persist, despite improvement in care of patients with HIV. Further studies need to be done to find out the underlying factors leading to these disparities.
Keywords
HAART
HIV/AIDS incidence
Kaposi's sarcoma
overall survival
racial disparities-relative survival
SEER

In the United States (US), majority of the Kaposi's sarcoma (KS) cases are diagnosed among patients infected with human immunodeficiency virus (HIV). After the introduction of highly active antiretroviral treatment (HAART), the incidence of KS has declined drastically and the survival of affected patients has increased remarkably in the US1. However, significant racial disparity has been reported in the incidence of KS and survival of KS patients in the HAART era. During 1995-2008, there was a significantly higher incidence of KS in the African-American (AA) population than in the non-Hispanic white (NHW) population in the US2.
AAs constitute only 12 per cent of the US population but contribute to 45 per cent of newly diagnosed HIV cases3. To reduce the disparities in the care and outcome of patients with HIV is one of the aims of US National HIV/AIDS Strategy (NHAS) and the Federal HIV Care Continuum Initiative4. Data from National HIV Surveillance System which are used to monitor progress towards reaching NHAS goals indicate that in the US, AAs have lower levels of care and viral suppression than persons of NHW origin5. Among newly diagnosed persons with HIV infection in 2012 who survived till 2013, 68.1 per cent of AAs received any HIV medical care compared with 74.4 per cent of whites6.
A Surveillance, Epidemiology and End Results (SEER)-based study on KS patients who were diagnosed during 1980-2004 reported significant improvement in the survival of NHW patients as compared to AA patients in the HAART era7. However, it was uncertain if this difference was the result of HAART, appearing first in the post-HAART period or existed before the introduction of HAART in the US (1996). Patient care for individuals affected by HIV continues to improve due to availability of more effective treatments, but it is unclear whether the improvement seen in the NHW population with KS soon after the introduction of HAART also appeared in the AAs with KS. Therefore, this study was aimed to analyze the disparities in the race-specific incidence rate and survival of KS patients of AA and NHW races, who were diagnosed during 1973-2013 using SEER population-based data.
Material & Methods
Study design: To estimate the trends in incidence rates and survival of KS patients in this retrospective study, the data reported in SEER database (released in April 2016) were analysed8. The SEER Program of National Cancer Institute (NCI) collects and publishes high-quality data on cancer incidence and survival from population-based cancer registries covering approximately 28 per cent of the US population8. It covers approximately 26 per cent of AA, 38 per cent of Hispanics, 44 per cent of American Indians and Alaska Natives, 50 per cent of Asians and 67 per cent of Hawaiian/Pacific Islanders. The SEER registries collect information on patient demographics, primary tumour site, tumour morphology, stage at diagnosis, first course of treatment, mortality and follow up for vital status8. The mortality data reported by SEER are obtained from the National Center for Health Statistics while the Census Bureau provides the population data which are used in calculating cancer rates. This database is updated annually and is provided as a public service in print and electronic formats.
Eligibility criteria and study groups: KS patients were identified using the third edition of International classification of Diseases for Oncology-O-3 (ICD-0-3) histology code 91409. All patients of AA and NHW ethnicities, of age 20 yr or more, who were diagnosed of KS during 1973-2013, were included. The study periods were analysed by allowing Joinpoint to empirically determine unique trend periods, for age-adjusted incidence rates (AAIRs)1011. However, survival analysis was conducted for the patients diagnosed in the study periods derived from Jointpoint analysis as well as for the following historical periods which corresponded with the epidemiology of HIV in the US: 1973-1980 (pre-HIV period), 1981-1995 (pre-HAART period) and 1996-2013 (HAART- period). The trends in the survival of KS patients were more consistent with the historical time periods which were based on the calendar years corresponding to onset of HIV epidemic and introduction of HAART in the US. Hence, for the final analysis, survival is shown in the three historical study periods.
Data collection: Data were collected on age, sex, race (NHW or AA), marital status, year of diagnosis, HIV status (from mortality records), vital status at the last follow up and survival period. Patients were excluded if the diagnosis was made at autopsy. In the absence of actual treatment data and lack of information on HIV status in considerable number of patients, calendar years were used as a proxy of HIV infection and treatment. In the US, KS in young patients is uncommon outside the setting of HIV infection1. The sudden rise in the number of KS patients in the SEER database after 1981, with majority being single and young males, suggested that most of these patients were HIV infected. Incidence rates were calculated for KS patients overall and by each age group, race and year of diagnosis to analyze trends over time. Incidence rates were calculated per 100,000 person-years and were age-adjusted to the 2000 US standard population incorporated in SEER* stat 8.3.2 (Surveillance Research Program, National Cancer Institute 2016). Changes in the slope of lines in the AAIRs over time were analyzed using permutation rates in a log-linear model in the SEER* Stat Joinpoint Regression Program 4.4.0.0 (Surveillance Research Program, National Cancer Institute 2017)1011.
A query was run in the SEER stat software to identify all cases of KS patients who were diagnosed at an age of 20 yr or above during the period 1973-2013. Patients were excluded if they were not present in the research database (8 cases) or their ages were unknown (3 cases). A total of 21, 843 patients were included in the analysis. For survival analysis, patients were excluded if their survival time was unknown (345 cases) or KS was not their first malignancy (1133 cases). Thus, 20,365 KS cases were included in the survival analysis.
To analyze disparities in various geographical regions, States in the SEER database were classified into four geographical regions according to the US census bureau12: Northeast=Connecticut and New Jersey; Midwest=Iowa and Michigan; West=California, Hawaii and Washington; Southwest=New Mexico and Utah; and South=Georgia, Kentucky and Louisiana. Historical time periods were used to analyze the trends in various geographical regions.
Statistical analysis: The survival period was calculated from the diagnosis date to the death date or to the last follow up available in the SEER database. Cause-specific survival in KS patients was estimated and adjusted for the expected survival rate of the US population for a particular age, sex and race to calculate the relative survival (RS). Two-sided P values were calculated from z scores, which were calculated using confidence intervals (CIs). Median overall survival (OS) was calculated using IBM SPSS Statistics, Version 24.0 (Armonk, NY, USA). Kaplan-Meier survival curves for OS in the AA and NHW populations in the different study periods were compared using the log-rank test. To determine the effect of race on survival, hazard ratios (HRs) were calculated after adjusting for age by using the Cox proportional hazard test.
Results
Incidence: A total of 21,843 patients were diagnosed with KS from 1973 to 2013, of whom 18,388 were NHWs and 3455 were AAs. In both races, majority of patients were men, single and diagnosed during 1981-1995. The general characteristics of patients and incidence rates of KS in each race are presented in Table I. In both pre-HAART and HAART periods, AA patients were younger than NHW patients. The median age of AAs and NHW patients was 37.5 [interquartile range (IQR): 32-57.5] and 47.5 yr (IQR: 37.5-62), respectively, in the HAART era (P<0.001).
| Characteristics | Total, n 21,843 | Non-Hispanic whites, n (%) 18,388 (100) | African-Americans, n (%) 3455 (100) | Ratio of incidence |
|---|---|---|---|---|
| Gender | ||||
| Male | 20,756 | 17,497 (95) | 3259 (94) | 0.83 |
| Female | 1087 | 891 (5) | 196 (6) | 0.43 |
| Marital status | ||||
| Single | 15,705 | 13,135 (71) | 2584 (75) | |
| Married | 2297 | 1995 (11) | 302 (9) | ** |
| Previously married | 1790 | 1531 (8) | 259 (7) | |
| Unknown | 2037 | 1727 (9) | 310 (9) | |
| Age at diagnosis (yr) | ||||
| <70 | 19,773 | 16,440 (89) | 3333 (96) | 0.75 |
| 20-44 | 14,866 | 12,228 (66) | 2638 (76) | 0.74 |
| 45-69 | 4907 | 4212 (23) | 695 (20) | 0.79 |
| ≥70 | 2070 | 1,948 (11) | 122 (4) | 1.17 |
| Year of diagnosis | ||||
| 1973-1980 (pre-HIV) | 268 | 254 (1) | 14 (<1) | 1.20 |
| 1981-1995 (pre-HAART) | 13,319 | 11,942 (65) | 1377 (40) | 1.14 |
| 1996-2013 (HAART) | 8256 | 6192 (34) | 2064 (60) | 0.35 |
| CHSDA region$ | ||||
| East | 4540 | 3121 (17) | 1419 (41) | 0.60 |
| Northern plains | 1289 | 895 (5) | 394 (11) | 0.36 |
| Pacific coast | 15,422 | 13,798 (75) | 1624 (47) | 0.92 |
| Southwest | 592 | 574 (3) | 1 8 (<1) | 0.52 |
| HIV positive | 11, 205 | 10,288 (56) | 1917 (55) | 0.85 |
| Vital status | ||||
| Alive | 5200 | 4185 (23) | 1015 (29) | 0.47 |
| Dead | 16,643 | 14,203 (77) | 2440 (71) | 0.90 |
**Incidence rates could not be calculated as marital status of standard population was not available in the SEER database. SEER, Surveillance Epidemiology End Results; HIV, human immunodeficiency virus; HAART, highly active antiretroviral treatment; CHSDA, Contract Health Service Delivery Areas States (n) & East=Connecticut (1026), Georgia (2453), Kentucky (131), Louisiana (308), New Jersey (622). Northern plains=Iowa (182), Michigan (1,107). Pacific Coast=California (13,573), Hawaii (324), Washington (1,525). Southwest=New Mexico (406), Utah (186)
Overall, the AAIR of KS per 100,000 person-years was significantly higher in AAs (2.96; 95% CI: 2.8-3.1) than in NHWs (2.3; 95% CI: 2.26-2.4) (P≤0.001). However, significant heterogeneity was noted among different time periods and age groups. The highest variability in AAIR was seen in the patients in age group 20-44 yr. After 1992 onwards, the AAIR of AAs superseded the AAIR of NHWs, and in the more recent time periods, the AAIR of patients of AA ethnicity was about four times higher than the AAIR of NHW. This difference was magnified further in the age group of 20-44 yr, wherein the AAIR of KS in AAs was approximately eight times higher than that in NHWs (Data not shown). A major demographic shift was observed in late 1990s among KS patients of NHW ethnicity where AAIR among patients in the 20-44 yr age group was lower than the AAIR in older age groups while such a shift was not observed for patients of AA ethnicity where AAIR was highest among the patients in 20-44 yr age group (Fig. 1). There was no difference in the AAIR between NHWs and AAs in the 1973-1980 time period or the age group of ≥70 yr.
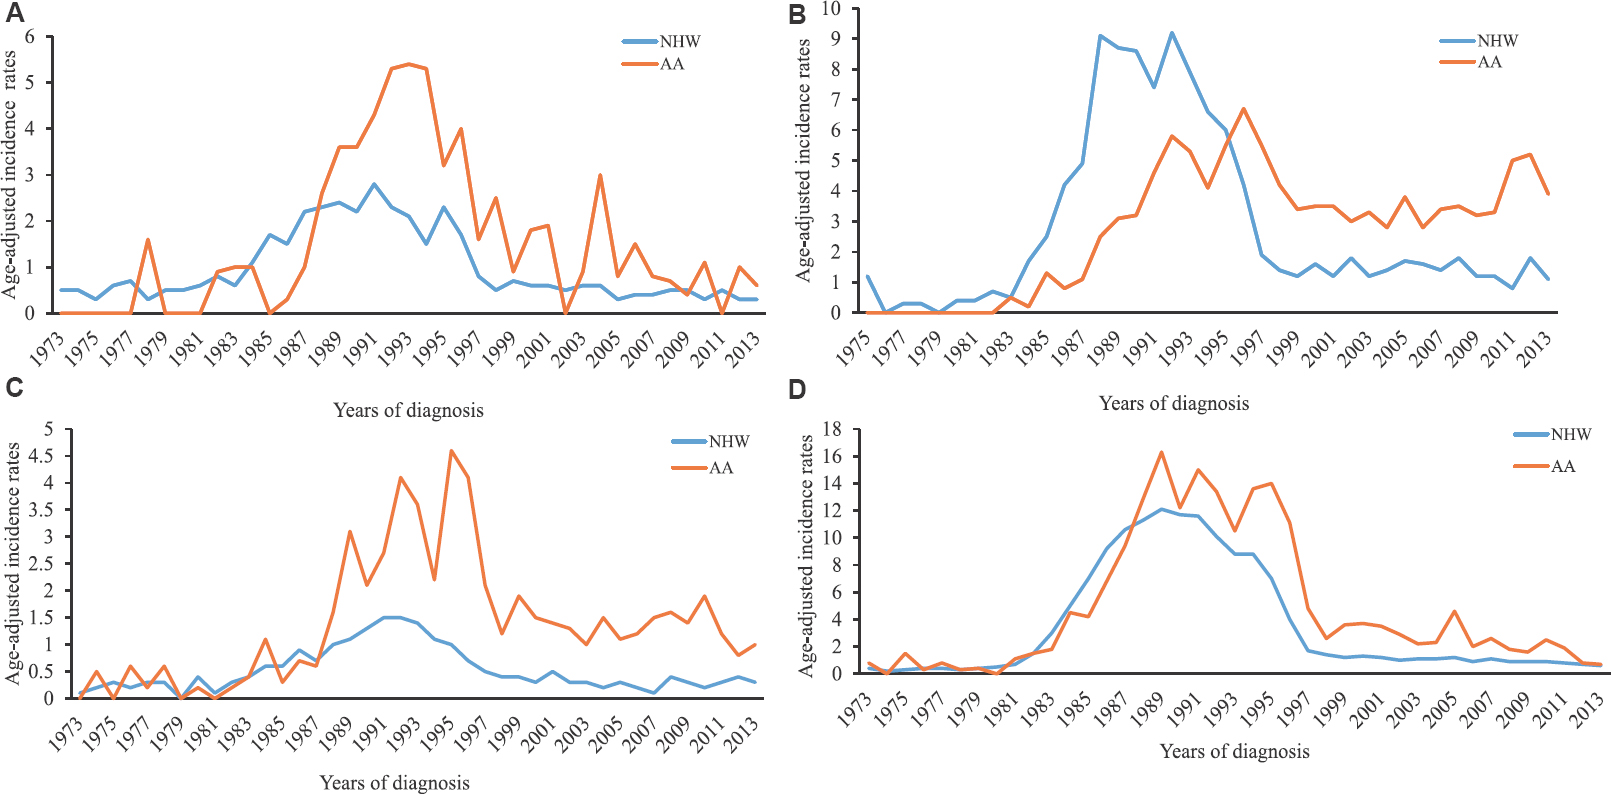
- Trends in the age-adjusted incidence rates (AAIR) of Kaposi's sarcoma in African-American (AA) and non-Hispanic white (NHW) in various geographical regions: (A) Northeast, (B) South, (C) Mildwest, and (D) West.
Trends from the Joinpoint regression analysis identified five (from 6 trend periods) and three (from 5 trend periods) points of statistically significant transitions in the AAIR of KS in NHW and AA races, respectively, between 1973 and 2013 (Fig. 2). The largest increase in the AAIR of KS in NHWs occurred during 1980-1985 [annual percentage change (APC): +69.9%; 95% CI: 56.8-84, P≤0.001], followed by a relatively slower but significant increase until 1988. Although the AAIR began decreasing during 1989-1994, a significant reduction was seen only during 1994-1998 (P≤0.001). Similarly, in the AA race, the incidence rate increased dramatically after 1980 and continued to increase until 1989 (APC: +41.6%; CI: 31.6-52.4; P≤0.001). In AAs, AAIR remained high during the Jointpoint period 1989-1995 when the AAIR in AA superseded NHW. The AAIR in AA declined significantly only during 1995-1999 (P=0.001). In the more recent period (1998-2013 for NHW and 1999-2015 for AA), a gradual but significant decline in AAIR was noted for both races; however, the reduction in AAIR in AAs (APC: −6.2; CI: −8.8 to −3.5) was slower than that in NHWs (APC: −10.9; CI: −12.6 to −9.1) (Fig. 2). When analyzed by the geographical regions, AAIR in NHW declined consistently after the introduction of HAART (Fig. 1). On the contrary, AAIR continued to increase among AAs in the midwestern and southern States for several years after the introduction of HAART. However, AAIR decreased in all four geographical regions in the more recent years. The highest rates of KS in the most recent time period were seen in the southern and western States. The disparities in the AAIRs were present across all geographical regions with the highest gap in the midwest (~5 times) followed by northeast and south (~2.5 times in each) and the western States (~2 times).
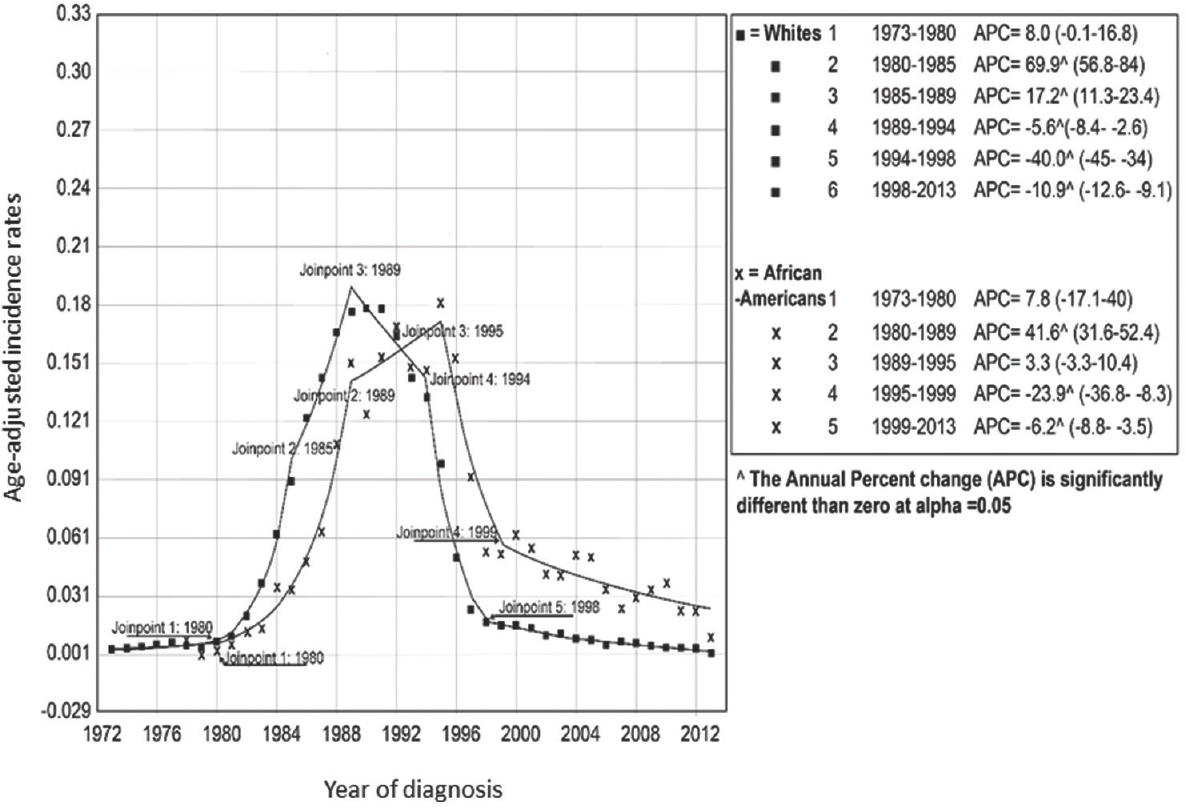
- Jointpoint regression analysis for trends in age-adjusted incidence rates of Kaposi's sarcoma in non-Hispanic white and African-American ethnicities. Values in parentheses are 95% CI.
Survival: In AAs, the increase in OS, RS and cause-specific survival in the HAART period was of lesser magnitude than that in the pre-HAART period. The median OS (119 months; 95% CI: 110-128) in NHWs was significantly higher than that (56 months; 95% CI: 46-66) in AAs (P≤0.001). The OS was not significantly different in the pre-HIV and pre-HAART periods in AAs or NHWs (Fig. 3). However, one-year cause-specific survival was better in NHWs as compared to AAs during 1980-1994 (Data not shown). After adjusting for age, the HR for all-cause mortality in AAs increased from 1.1 (95% CI: 1-1.2) in 1981-1995 to 1.55 (95% CI: 1.4-1.7) in 1996-2013 as compared to NHWs.
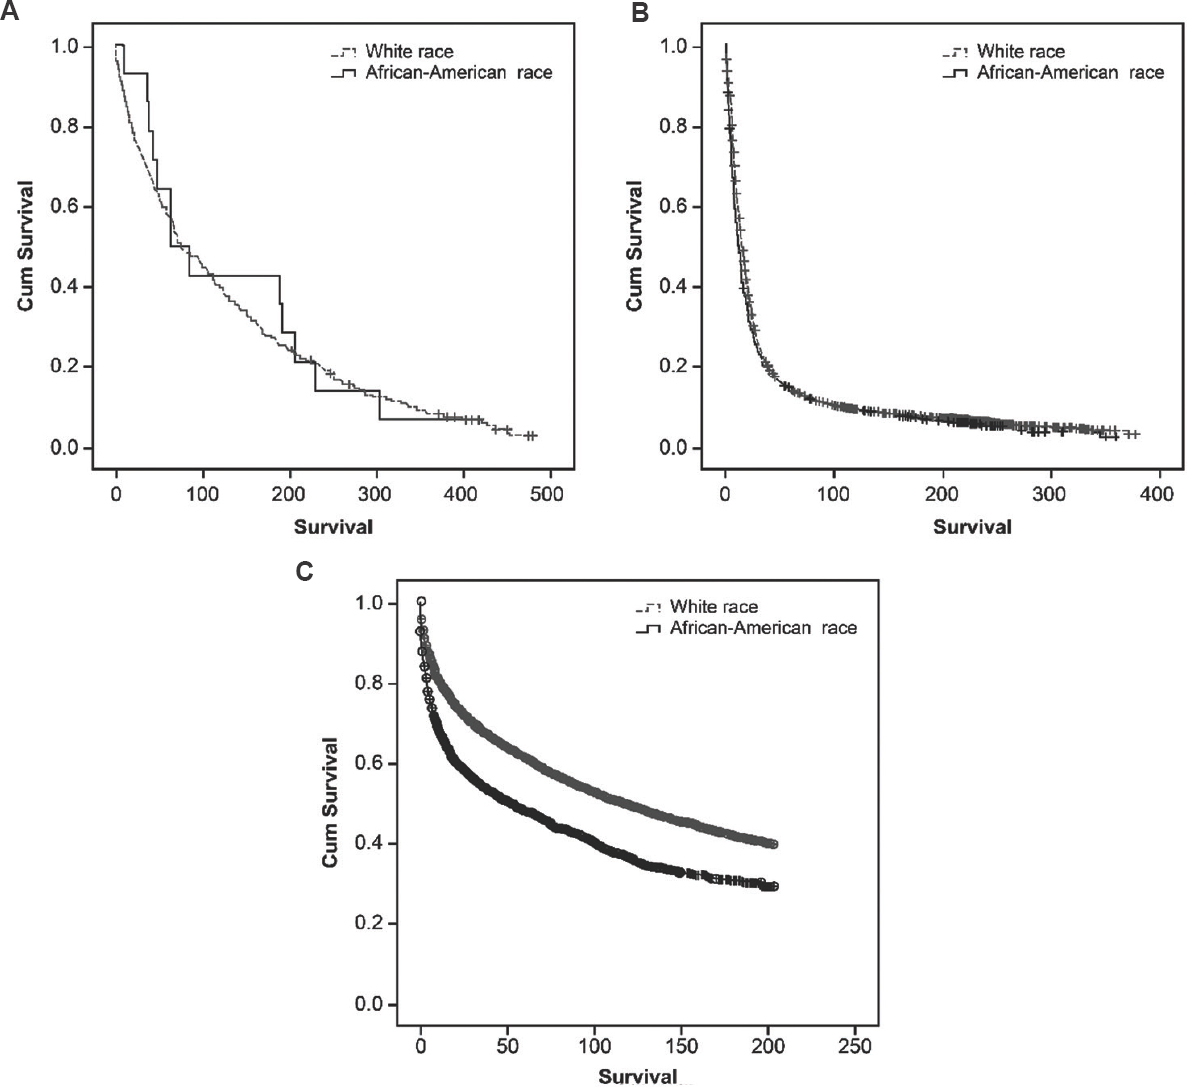
- Kaplan-Meier survival curves for overall survival of Kaposi's sarcoma patients in non-Hispanic white and African-American ethnicities during (A) 1973-1980, (B) 1981-1995 and (C) 1996-2013.
We estimated the RS and cause-specific survival to adjust for overall lower life expectancy and other competing causes of deaths in AAs as percentages of people surviving 1 and 5 yr after diagnosis of KS. In addition, our analysis revealed that in the HAART era, a significantly lower percentage of AAs survived than NHWs; the maximum disparity was observed in the age group of 20-44 yr (Table II). Trends in the cause-specific survival mirrored the RS trends (Table III). After adjusting for age and period of diagnosis, the HR for cause-specific mortality in AAs increased from 1.1 (95% CI: 1.1-1.2) in 1981-1995 to 1.55 (95% CI: 1.4-1.7) in 1996-2013. The survival of AA and NHW patients was not significantly different in the age group of ≥70 yr.
| Age group (yr) | Period of diagnosis | Time since diagnosis (months) | Non-Hispanic Whites % (95% CI) | African-Americans % (95% CI) | P value |
|---|---|---|---|---|---|
| All ages | 1973-1980 | 12 | 93.5 (89.3-96.1) | 100† | 0.34 |
| 60 | 89.9 (84.9-93.3) | 100† | 0.22 | ||
| 1981-1995 | 12 | 66 (65.1-66.9) | 54.6 (51.8-57.4) | <0.001 | |
| 60 | 19.1 (18.2-19.9) | 18.5 (16.3-20.8) | 0.58 | ||
| 1996-2013 | 12 | 83.6 (82.6-84.6) | 70.8 (68.7-72.8) | <0.001 | |
| 60 | 71.5 (70.2-72.8) | 55.4 (53-57.8) | <0.001 | ||
| 20-69 | 1973-1980 | 12 | 98.7 (91.1-99.8) | 100† | 0.66 |
| 60 | 96 (88.2-98.7) | 100† | 0.72 | ||
| 1981-1995 | 12 | 64.8 (63.9-65.8) | 54.1 (51.2-56.8) | <0.001 | |
| 60 | 16.7 (15.9-17.4) | 17.7 (15.5-20) | 0.38 | ||
| 1996-2013 | 12 | 81.2 (80.1-82.4) | 70.1 (67.9-72.2) | <0.001 | |
| 60 | 68 (66.5-69.4) | 54.5 (52-56.9) | <0.001 | ||
| 20-44 | 1981-1995 | 12 | 65.1 (64.1-66.2) | 52.2 (49.1-55.2) | <0.001 |
| 60 | 15.4 (14.5-16.2) | 15.3 (13.1-17.7) | 0.65 | ||
| 1996-2013 | 12 | 79.4 (77.8-80.8) | 68.2 (65.6-70.6) | <0.001 | |
| 60 | 64.7 (62.8-66.5) | 52.5 (49.6-55.2) | <0.001 | ||
| 45-69 | 1981-1995 | 12 | 63.7 (61.5-65.7) | 64.5 (57.1-70.9) | 0.90 |
| 60 | 22.2 (20.1-24.1) | 30.8 (25.1-36.7) | 0.005 | ||
| 1996-2013 | 12 | 84.6 (82.7-86.3) | 76.4 (72-80.3) | <0.001 | |
| 60 | 74.1 (71.7-76.3) | 61.2 (55.9-66.1) | <0.001 | ||
| ≥70 | 1973-1980 | 12 | 90.7 (84.4-94.5) | 100† | 0.33 |
| 60 | 86.4 (79.3-91.2) | 100† | 0.23 | ||
| 1981-1995 | 12 | 96.3 (93.9-97.7) | 90.2 (66.2-97.5) | 0.18 | |
| 60 | 86.7 (82.4-90) | 82.7 (54.2-94.3) | 0.45 | ||
| 1996-2013 | 12 | 96.1 (94.5-97.2) | 90.6 (80.2-95.6) | 0.15 | |
| 60 | 91 (88.5-93) | 85 (71.2-91.5) | 0.10 |
†Due to the small number of patients of AA ethnicity in the age group <70 years, further subgroup analysis was not performed during the study period 1973-1980. All P values are two-sided and significant at P≤0.05
| Period of Diagnosis | Months since diagnosis | Non-Hispanic Whites % survival (95%CI) | African-Americans % survival (95% CI) |
|---|---|---|---|
| 1973-80 | 12 | 93.5 (89.3-96.1) | 100.0† |
| 60 | 89.9 (84.9-93.3) | 100.0† | |
| 1981-84 | 12 | 86.8 (83.6-89.4) | 84.1 (67.9-92.5) |
| 60 | 52.2 (46.7-57.3) | 56.6 (35.0-73.5) | |
| 1985-88 | 12 | 71.0 (69.0-73.0) | 59.6 (51.2-67.1) |
| 60 | 16.5 (14.7-18.4) | 21.0 (14.5-28.3) | |
| 1989-93 | 12 | 67.6 (65.9-69.3) | 58.6 (53.8-63.1) |
| 60 | 15.3 (13.9-16.7) | 15.7 (12.3-19.4) | |
| 1994-97 | 12 | 70.8 (68.3-73.1) | 59.7 (54.3-64.6) |
| 60 | 45.0 (42.2-47.7) | 38.3 (33.1-43.5) | |
| 1998-2013 | 12 | 87.9 (86.1-89.4) | 72.5 (69.2-75.6) |
| 60 | 78.7 (76.4-80.8) | 57.9 (54.1-61.5) |
†Subgroup analysis not done
Discussion
Our study showed that in the US, KS affected AAs at a younger age than the NHWs. The AAIR of KS patients of both the ethnicities witnessed several periods of fluctuations as estimated by Jointpoint analysis, but the decline in the AAIR of KS among NHWs preceded that of AAs. The decline in the AAIR was mostly seen in the patients aged 20-44 yr in both the ethnicities, but in NHWs, the AAIR among this age group witnessed greater decline and became lower than the older age groups. On the contrary, AA patients in this age group showed the highest AAIR. The higher AAIRs among AAs were observed across all the geographical regions. The OS of KS patients improved in both the ethnicities in the period corresponding to HAART era, but OS among NHWs was significantly higher than the OS of AA patients of KS.
KS affected AAs at a younger age than NHWs which is likely due to its high association with HIV infection, as HIV-affected AA individuals are of younger age13. Before HAART, the incidence of KS was higher in NHWs due to higher incidence of HIV infection in this race14. The incidence rates among NHWs started declining in the period 1989-1994; however, such trends in the incidence rates were not observed for patients of AA ethnicity. The incidence rates of KS patients of AA ethnicity declined only during 1995-1998 which corresponded to introduction of HAART in the US. The decline in the incidence rates of KS among NHWs before introduction of HAART actually reflects trends of HIV infection in the US. Although the incidence of KS continued to decline in both races after many years of HAART introduction, the decline in incidence rates in AAs was less than that in NHWs, leading to 3-4 times higher incidence in AAs. The slower rate of decline in the AA population reflected higher incidence of HIV infection and poor disease control in this population as compared to the NHW population. As per a study published in 2011, AA homosexual men accounted for the largest proportion of HIV cases in the US15. Furthermore, the disparities in HIV treatment between AAs and NHWs may also contribute to these differences16. The cause of lower rates of treatment of HIV patients of AA race is multifactorial and includes lower socio-economic status and less faith in the health system171819. Adherence to HAART which is a key to successful HIV treatment success was lower in AA patients than in NHW patients18. The racial disparities in the incidence rates were consistently present across all the geographical regions. The highest difference was seen in the midwestern States. In the absolute terms, the highest AAIR was observed in the southern States. This was consistent with the fact that the HIV care among AAs in the southern States lagged behind rest of the regions20.
The trends in the survival did not follow incidence trends in this study. We studied survival in the trend periods obtained for incidence rates, but trends in survival were more consistent with the historical time periods corresponding to epidemiology of HIV in the US. The survival of KS patients of both the ethnicities was similar before HIV infection. After HIV epidemic, the OS and RS were not significantly different in the two ethnicities, but on close inspection, one-year survival was significantly worse among the AAs. This could be associated with greater degree of immunosuppression among AAs leading to more advanced stage tumour at diagnosis resulting poor short-term survival in the pre-HAART period. Unfortunately, there is no information on level of immunosuppression in the SEER database and this remains to be confirmed. The long-term survival was not significantly different in the pre-HAART era. Although the OS and RS of KS increased significantly after HAART introduction, improvement in survival in AAs was not at par with that in NHWs, leading to a noticeable gap in the survival rates between the two races. The racial differences in the treatment of KS besides HAART (differences in tumour biology or drug response) are although not clear, but may also contribute to differences in survival. In the HAART period, the HRs for all-cause and cause-specific mortality increased by 40 per cent in AAs as compared to NHWs. A previous study published using data up till 2004 reported a significantly higher improvement in the survival of NHWs as compared to AAs, and KS patients of NHW race did not reach the median survival up till 20047. In the current study, the median OS in NHWs was more than two times higher than that in AAs. The gap in survival of KS patients between NHW and AA races persisted despite adjustment for lower life expectancy in AAs by estimation of cause-specific survival and RS. These adjustments were performed because AAs have a higher risk of death due to other causes such as multiple co-morbidities, homicides and illicit drug use than NHWs2122.
The role of human herpesvirus-8 (HHV-8) genotype on racial disparities could not be evaluated in this study. However, it is worth noting that the prevalence of HHV-8 remains high among male homosexuals in the US23. Among NHW homosexuals, seroconversion was noticed in their third decade of life23. However, such an association among AA homosexuals has not been studied thoroughly. In a meta-analysis of worldwide HIV and HHV-8 co-infection, of all the groups studied, the HIV-positive homosexuals were the most likely to be coinfected with OR of 3.95 (95% CI: 2.92-5.35)24. More studies are warranted on the seroprevalence of HHV-8 in AAs and its role in the development of KS.
The trends in patients aged ≥70 yr have been stable since 1973. This is expected because presumably, most of these cases are not related to HIV infection, unlike the case in younger patients25. The incidence and survival rates were similar in AAs and NHWs of this age group, without any appreciable change over the years.
The major strengths of this study were its large sample size and long follow up period. The SEER ascertainment rate is 98 per cent, which prevents bias introduced by hospital records26. However, our findings should be interpreted cautiously due to the following limitations. First, the data on HIV status were collected from the mortality records, which may be incomplete, leading to a possible misclassification bias. However, KS in young patients without HIV infection is rare in the US25, and the risk of misclassification due to this assumption is low. Second, in the absence of accurate treatment information, we used the year of HAART introduction as a surrogate for HAART treatment. Third, we did not find any information on the immunosuppression level, treatment rates and adherence in the SEER registry. Therefore, their role in the incidence and survival of KS patients could not be confirmed. Besides, there was no information on severity of KS in the SEER database and thus its effect on survival could not be analyzed.
In conclusion, this analysis showed a significant disparity in the incidence of KS and survival of AA and NHW KS patients in the US after HAART introduction. The incidence rates of KS declined in NHWs before the introduction of HAART in contrast to AAs. The incidence of KS was approximately 3-4 times higher in AAs. The incidence rates of KS were highest in the older age group among NHWs in contrast to AAs where highest risk was present among the patients of age group 20-44 years. In addition, KS patients of AA race had lower survival than those of NHW race. Further studies should explore the underlying factors leading to this inequality between ethnicities in the US.
Acknowledgment:
The data for this study was extracted from the SEER database. The interpretation and reporting of these data are the sole responsibility of the authors. The authors acknowledge the efforts of the Applied Research Program, NCI; Information Management Services Inc. and the SEER program registries in the creation and maintenance of the database as a research resource.
Financial support & sponsorship: None.
Conflicts of Interest: None.
References
- Trends in Kaposi's sarcoma and non-Hodgkin's lymphoma incidence in the United States from 1973 through 1998. J Natl Cancer Inst. 2002;94:1204-10.
- [Google Scholar]
- Racial and ethnic disparities in the incidence and trends of soft tissue sarcoma among adolescents and young adults in the United States, 1995-2008. J Adolesc Young Adult Oncol. 2013;2:89-94.
- [Google Scholar]
- Progress along the continuum of HIV care among blacks with diagnosed HIV- United States, 2010. MMWR Morb Mortal Wkly Rep. 2014;63:85-9.
- [Google Scholar]
- White House Office of National AIDS Policy. National HIV/AIDS strategy for the United States: updated to 2020, Federal Action Plan. Washington, DC: White House Office; 2015.
- Centers for Disease Control and Prevention. HIV Care Outcomes MMWR Media Summary. Available from: www.cdc.gov/nchhstp/newsroom/2017/nbhaad-hiv-care-outcomesmmwr-media-summary.html
- Centers for Disease Control and Prevention. Monitoring selected national HIV prevention and care objectives by using HIV surveillance data-United States and 6 dependent areas, 2014. HIV Surveillance Supplemental Report 2016. Vol 21. Atlanta, GA: US Department of Health and Human Services, CDC; 2016.
- Trends in Kaposi's sarcoma survival disparities in the United States: 1980 through 2004. Cancer Epidemiol Biomarkers Prev. 2010;19:2718-26.
- [Google Scholar]
- International classification of diseases for oncology: ICD-O. World Health Organization 2013
- [Google Scholar]
- National Cancer Institute. Overview of the SEER Program. Available from: https://www.seer.cancer.gov/about/overview.html
- Joinpoint Regression Program, Version 4.5.0.1. Statistical Methodology and Applications Branch, Surveillance Research Program. 2017. National Cancer Institute Bethesda. Available from: https://surveillance.cancer.gov/joinpoint/Joinpoint_Help_4.5.0.1.pdf
- [Google Scholar]
- Permutation tests for join point regression with applications to cancer rates. Stat Med. 2000;19:335-51.
- [Google Scholar]
- U.S. Census Bureau. Census Bureau Regions and Divisions with State FIPS codes. Available from: https://www2.census.gov/geo/pdfs/maps-data/maps/reference/us_regdiv.pdf
- Age at cancer diagnosis for blacks compared with whites in the United States. J Natl Cancer Inst. 2015;107 pii: dju489
- [Google Scholar]
- Centers for Disease Control and Prevention. Diagnoses of HIV Infection in the United States and Dependent Areas, 2013. HIV Surveillance Report. Vol 25. Atlanta, GA: US Department of Health and Human Services, CDC; 2015.
- The role of cultural distance between patient and provider in explaining racial/ethnic disparities in HIV care. Patient Educ Couns. 2011;85:e278-84.
- [Google Scholar]
- Discrimination, distrust, and racial/ethnic disparities in antiretroviral therapy adherence among a national sample of HIV-infected patients. J Acquir Immune Defic Syndr. 2008;49:84-93.
- [Google Scholar]
- Race and mental health diagnosis are risk factors for highly active antiretroviral therapy failure in a military cohort despite equal access to care. J Acquir Immune Defic Syndr. 2007;44:411-6.
- [Google Scholar]
- Racial/Ethnic disparities in ART adherence in the United States: Findings from the MACH14 study. J Acquir Immune Defic Syndr. 2012;60:466-72.
- [Google Scholar]
- Numeracy skills explain racial differences in HIV medication management. AIDS Behav. 2010;14:799-806.
- [Google Scholar]
- Centers for Disease Control and Prevention. 2015 National HIV Prevention Conference. Available from: https://www.cdc.gov/nchhstp/newsroom/2015/nhpc.html
- Proportions of Kaposi sarcoma, selected non-Hodgkin lymphomas, and cervical cancer in the United States occurring in persons with AIDS, 1980-2007. JAMA. 2011;305:1450-9.
- [Google Scholar]
- Miles to go before we sleep: Racial inequities in health. J Health Soc Behav. 2012;53:279-95.
- [Google Scholar]
- Epidemiology of Kaposi's sarcoma-associated herpesvirus in HIV-1-infected US persons in the era of combination antiretroviral therapy. AIDS. 2015;29:1217-25.
- [Google Scholar]
- HIV and human herpesvirus 8 co-infection across the globe: Systematic review and meta-analysis. Int J Cancer. 2016;138:45-54.
- [Google Scholar]
- Completeness of hospital cancer case reporting from the SEER program of the national cancer institute. Cancer. 1995;76:2343-50.
- [Google Scholar]
- Key Statistics About Kaposi Sarcoma. Available from https://www.cancer.org/cancer/kaposi-sarcoma/about/what-is-key-statistics.html


