
Translate this page into:
Intrapatient variability in plasma rifampicin & isoniazid in tuberculosis patients
For correspondence: Dr Geetha Ramachandran, Department of Biochemistry & Clinical Pharmacology, ICMR-National Institute for Research in Tuberculosis, Mayor Sathyamoorthy Road, Chetpet, Chennai 600 031, Tamil Nadu, India e-mail: geetha202@rediffmail.com
-
Received: ,
This is an open access journal, and articles are distributed under the terms of the Creative Commons Attribution-NonCommercial-ShareAlike 4.0 License, which allows others to remix, tweak, and build upon the work non-commercially, as long as appropriate credit is given and the new creations are licensed under the identical terms.
This article was originally published by Medknow Publications & Media Pvt Ltd and was migrated to Scientific Scholar after the change of Publisher.
Abstract
Background & objectives:
Large variability in anti-tuberculosis (TB) drug concentrations between patients is known to exist. However, limited information is available on intrapatient drug levels during the course of anti-TB treatment (ATT). This study was conducted to evaluate intrapatient variability in plasma rifampicin (RMP) and isoniazid (INH) concentrations during ATT at start of the treatment, at the end of intensive phase (IP) of ATT and at the end of ATT in adult TB patients being treated in the Revised National TB Control Programme (RNTCP).
Methods:
Adult TB patients (n=485), receiving thrice-weekly ATT in the RNTCP, were studied. Two-hour post-dosing concentrations of RMP and INH were determined at month 1, end of IP and end of ATT, after directly observed drug administration. Drug concentrations were estimated by high-performance liquid chromatography.
Results:
The median (inter-quartile range) RMP concentrations during the first month, at end of IP and end of ATT were 2.1 (0.4-5.0), 2.4 (0.6-5.5) and 2.2 (0.5-5.3) μg/ml, respectively. The corresponding INH concentrations were 7.1 (4.2-9.9), 7.2 (3.9-10.9) and 6.7 (3.9-9.5) μg/ml. None of the differences in drug concentrations obtained at different time points during ATT were significant. RMP and INH concentrations at different time points were significantly correlated. Age and body mass index caused significant variability in drug concentrations.
Interpretation & conclusions:
Plasma RMP and INH estimations in adult TB patients at two hours after drug administration remained unaltered during ATT. Clinicians can consider testing drug concentrations at any time point during ATT. These findings may assume significance in the context of therapeutic drug monitoring of anti-TB drug concentrations.
Keywords
Intrapatient variability
isoniazid
plasma drug concentrations
Revised National TB Control Programme
rifampicin
tuberculosis

Tuberculosis (TB) remains the leading cause of death from a curable infectious disease. Majority of patients who receive a total of six months of anti-TB treatment (ATT) for drug-susceptible TB respond completely to treatment1. The most frequently used drugs are isoniazid (INH), rifampicin (RMP), pyrazinamide (PZA) and ethambutol (EMB). The Revised National TB Control Programme (RNTCP) in India provides ATT under Directly Observed Treatment (DOT), favourable treatment outcomes being obtained in 85 per cent of patients with drug-susceptible TB2. Despite these established standards, there is a paucity of information on the possible mechanisms to explain treatment failures, relapses and acquired drug resistance3. Furthermore, slow response to ATT can lead to prolonged infectiousness, extended treatment duration, acquired drug resistance or recurrence of TB after treatment. Low serum concentrations of anti-TB drugs have been shown to be associated with treatment failure, relapse and acquired drug resistance in HIV-infected and non-HIV-infected TB patients456789101112. It has been reported that majority of pulmonary TB patients who are slow to respond to ATT have two-hour RMP and INH concentrations below the expected range13. A large interpatient variability in drug concentrations has also been reported614. Most studies, however, have analyzed drug concentrations at one point of time during ATT. The aim of the present study was to understand intrapatient variability in plasma RMP and INH concentrations during ATT, at start of the treatment, at the end of intensive phase (IP) of ATT and at the end of ATT in adult TB patients.
Material & Methods
A prospective study was undertaken in adult patients with either pulmonary or extrapulmonary TB receiving ATT in the RNTCP treatment centres in Chennai Corporation, Chennai, India, during January 2015 to August 2015. Patients were included from the TB units in Pulianthope, Chintadripet, Basin Bridge, Kodambakkam, Saidapet, Tondiarpet, Sembium and Periyar Nagar. Diagnosis and treatment was according to RNTCP guidelines2. Patients received either Category I or Category II treatment. Category I treatment consisted of a six-month thrice-weekly regimen with RMP, INH, PZA and EMB for two months, followed by RMP and INH for four months2. Category II treatment consisted of a thrice-weekly eight-month regimen with streptomycin, INH, RMP, PZA and EMB for two months, followed by INH, RMP, PZA and EMB for one month and INH, RMP and EMB for the remaining five months. The drug doses were RMP 450 mg (600 mg for those ≥60 kg body weight), INH 600 mg, EMB 1200 mg, PZA 1500 mg and streptomycin 0.75 g. Patients were eligible to take part in this study if they met the following study criteria: (i) aged 18 yr or above, (ii) body weight not <30 kg, (iii) received at least two weeks of ATT regularly, (iv) not very sick or moribund, (v) willing to participate and give informed written consent, and (vi) agreeing to come to the same DOT centre until completion of the study. The study commenced after obtaining approval from the Institutional Ethics Committee of the ICMR-National Institute for Research in Tuberculosis (NIRT), Chennai. A structured questionnaire was used to elicit patient details.
Sample size: In the absence of published information on anti-TB drug concentrations from the same patient at different time points during ATT, data from a pilot study with 100 patients from NIRT, Chennai were taken for sample size calculation. The mean and standard deviation of RIF plasma concentrations at month one and at the end of IP were 2.9±2.8 μg/ml and 3.4±3.5 μg/ml, respectively. With a correlation of 27 per cent between these time points, the sample size was calculated as 368 patients assuming 95 per cent confidence interval and 80 per cent power. Accounting for 25 per cent loss during follow up (19% default and 6% death under programme conditions15), the minimum sample size was calculated as 460.
Study procedures: Patients diagnosed with TB, were referred to the study investigator by the medical officers at the identified TB units. The purpose of the study and procedures were explained to those patients who fulfilled the study criteria. Patients, who were willing to participate, were recruited after obtaining informed written consent. The study was conducted at the respective TB units on three occasions (during the first month, at the end of IP and at end of ATT). The first sample was collected at steady state after patients had received a minimum of seven doses of ATT and during the first month of start of treatment. On each occasion, the anti-TB drugs were administered under direct supervision and about 3 ml blood was collected at two hours post-dosing in heparinized vacutainer tubes. The time at which the patients ate their breakfast was noted on each occasion. The blood was centrifuged immediately and plasma was separated. Ascorbic acid solution was added to plasma to prevent oxidation of RMP. The plasma samples were stored at −20°C until analysis.
Drug estimations: All drug estimations were undertaken within a week of sample collection. Plasma RMP and INH concentrations were determined by high-performance liquid chromatography (Shimadzu Corporation, Kyoto, Japan). Plasma RMP was extracted using acetonitrile and analysis performed using C18 column at 254 nm. The retention time of RMP was 1.7 min16. Plasma INH and PZA were estimated simultaneously by extraction using para-hydrobenzaldehyde and trifluoroacetic acid. Analysis was performed using a C8 column at 267 nm. The retention times of PZA and INH were 3 and 5.5 min, respectively17. The methods were highly specific with no interfering peaks at the retention times of the drugs. The between and within run variations for all the drugs were below 10 per cent. The lower limits of quantification for RMP, INH and PZA were 0.25, 0.25 and 1.25 μg/ml, respectively.
Statistical analysis: Data analysis was performed using SPSS, version 20.0, Predictive Analytics Software (IBM Corporation, USA). The values were expressed as median and interquartile range (IQR). Pearson's correlation was performed to assess the degree of relationship amongst RMP and INH concentrations estimated at different time points in the same patient during ATT. Repeated measures analysis of variance (ANOVA) was performed to assess the variation amongst the drug concentrations at different time points. Multivariable-adjusted repeated measures linear regression with random effect was performed to identify factors that caused variations in drug concentrations between patients across time. Pairwise missing cases were excluded in the analysis.
Results
A total of 485 patients took part in the study. Their median (IQR) age and body mass index (BMI) were 38 (28-50) years and 18.6 (16.0-21.6) kg/m2, respectively. Males constituted 68 per cent of the study population; all patients were HIV seronegative. Of the total number of 485 patients, drug concentrations at the end of IP were available in 357 patients and at the end of ATT in 348 and 352 patients for RMP and INH, respectively. About 97 per cent of the study participants took their anti-TB medications after breakfast; 90 per cent of them took the drugs within one hour of taking breakfast. The median (IQR) RMP concentrations during the first month, at the end of IP and end of ATT were 2.1 (0.4-5.0), 2.4 (0.6-5.5) and 2.2 (0.5-5.3) μg/ml, respectively. The corresponding INH concentrations were 7.1 (4.2-9.9), 7.2 (3.9-10.9) and 6.7 (3.9-9.5) μg/ml. None of the differences in drug concentrations obtained at different time points in the same patient during the course of ATT were significant (Figure).
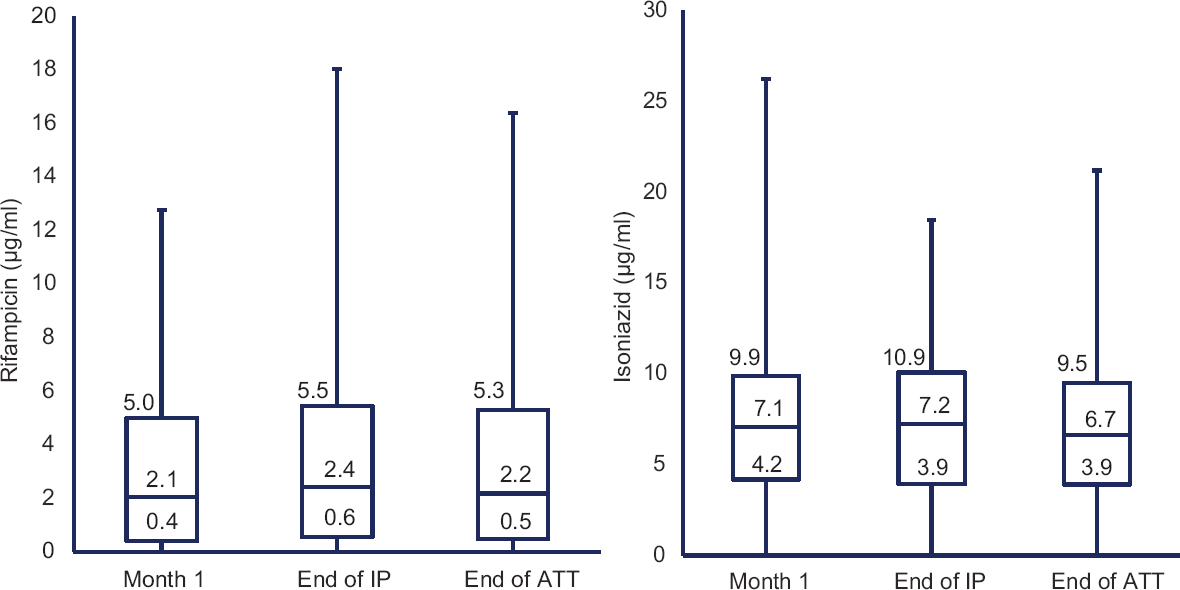
- Two-hour drug concentrations at different time points. Pairwise comparison was not significant and values in the box plot indicate the median and interquartile range. IP, intensive phase; ATT, anti-TB treatment.
A significant correlation was found between RMP concentrations obtained at different time points, the r values being 0.30, 0.26 and 0.21 for month one versus end of IP, month one versus end of ATT and end of IP versus end of ATT, respectively (P<0.001). The corresponding r values in the case of INH were 0.15, 0.22 and 0.24, respectively (P<0.001).
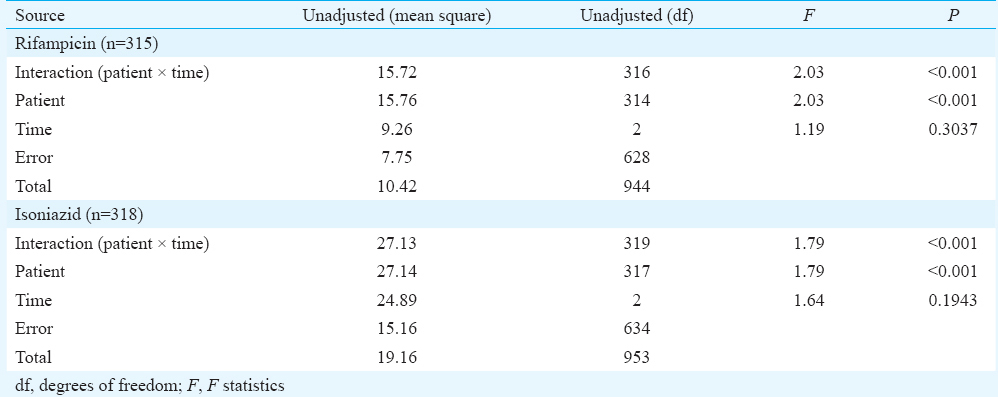
Comparisons of plasma RMP concentration from 315 individuals and INH concentration from 318 individuals between month 1, end of IP and end of ATT were carried out using repeated measures ANOVA; differences were not significant within the same patient over a time period (Table I). However, significant differences were observed in RMP and INH concentrations between patients (P<0.001). Pairwise comparison did not show any significant differences in drug concentrations.
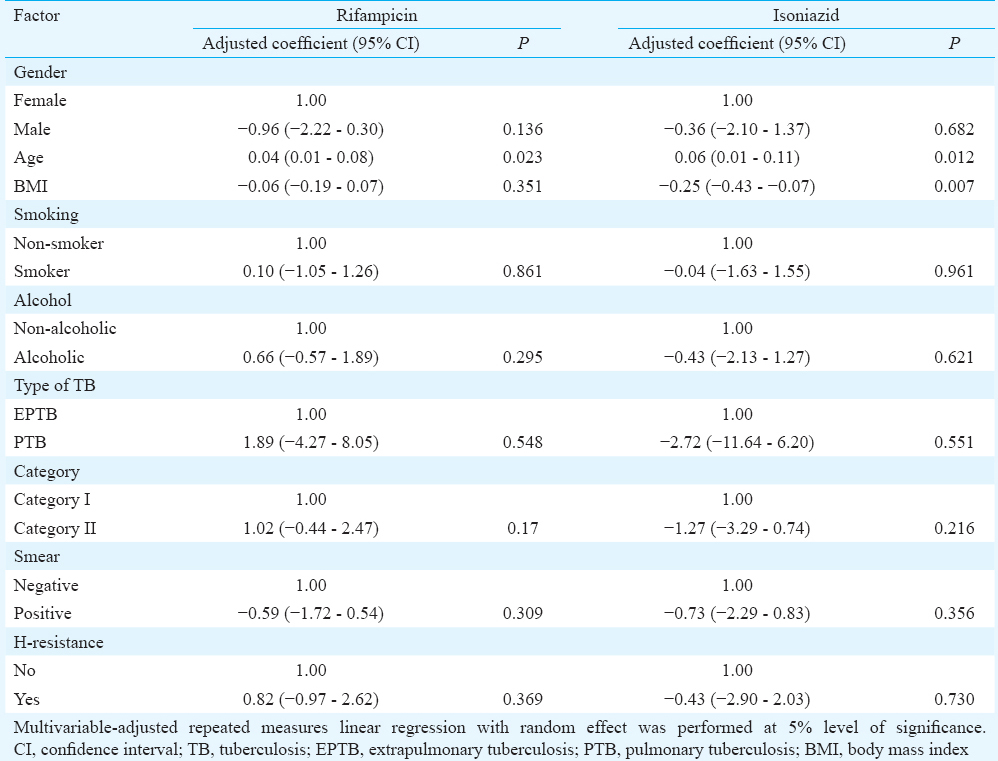
Adjusted repeated measures’ linear regression with random effect was performed to identify factors (gender, age, BMI, alcoholism, smoking, category of ATT, type of TB, smear status and baseline INH resistance) that caused variations in RMP and INH concentrations. While age significantly influenced RMP concentrations, age and BMI had a significant influence on INH concentrations. An increase of one unit of age caused an average increase of 0.04 μg/ml (0.01-0.08 μg/ml; P=0.023) and 0.06 μg/ml (0.01-0.11 μg/ml; P=0.012) in RMP and INH concentrations, respectively, over time points. Likewise, an increase of one unit of BMI caused an average decrease of −0.25 ug/ml (−0.43 to −0.07 ug/ml; P=0.007) in INH concentration (Table II).
Discussion
This study was undertaken to obtain information on intrapatient variations in the two-hour post-dosing concentrations of two key anti-TB drugs, namely, RMP and INH. This information would be important to understand the relationship between anti-TB drug concentrations and treatment outcome.
This study showed that RMP and INH concentrations were not significantly altered during the course of ATT. In view of this finding, drug estimations at any convenient point of time during the course of ATT can be carried out. Any increase caused due to cure of the disease was probably nullified by increase in the body weight of the patient. It is to be expected that body weight increases as TB treatment progresses and patient responds to ATT. Food is known to adversely impact RMP and INH concentrations18. We have cautiously analyzed the study data in the context of time of food intake. It was observed that a large majority of the patients took drugs after having their breakfast, mostly within an hour. Hence, food was unlikely to have influenced our study findings.
It may not always be possible to conduct intensive or semi-intensive pharmacokinetic studies that require blood samples to be collected at multiple time points, especially in the clinical/field setting due to financial and logistical constraints. It has been suggested that the two-hour post-dose concentrations of RMP, INH and PZA are usually most informative19.
Age and BMI emerged as significant factors causing variation in drug concentrations between patients. While there was a direct relationship between age and variability, the reverse was true in the case of BMI. Undernourished patients had higher variation in INH concentrations compared to well-nourished patients. The exact reasons are unclear. Since data on INH acetylator status were not available for majority of the study patients, this factor was included in the regression model. However, it is well known that acetylator status significantly influences INH concentrations and causes variability14. Although the study findings are valid for group comparisons and programme purposes, the same may not be true for the management of individual patients in clinical practice.
In conclusion, this study findings showed that RMP and INH estimations at two hours after drug administration remained unaltered during ATT. However, time of food intake is likely to have a major impact on drug concentrations. These findings could be helpful to the treating physicians, since they can rely on the drug concentrations obtained at any given time point during the course of ATT. Furthermore, it may not be possible to determine drug concentrations at different points of time during ATT in patients treated in the RNTCP. Hence, for the purpose of therapeutic drug monitoring of anti-TB drug concentrations, these findings assume significance.
Acknowledgment
The authors thank the field investigators engaged in patient recruitment, Ms. V. Sudha for carrying out drug estimations and staff at the RNTCP treatment centres in the Chennai Corporation.
Financial support & sponsorship: Funding by the United States Agency for International Development through World Health Organisation, SEARO, New Delhi, India, is acknowledged
Conflicts of Interest: None.
References
- Role of individual drugs in the chemotherapy of tuberculosis. Int J Tuberc Lung Dis. 2000;4:796-806.
- [Google Scholar]
- Revised National TB Control Programme Annual Status Report. New Delhi: Central TB Division, Directorate General of Health Services, Ministry of Health & Family Welfare, Government of India; 2011. p. :98-101.
- [Google Scholar]
- Eleven years of community-based directly observed therapy for tuberculosis. JAMA. 1995;274:945-51.
- [Google Scholar]
- Low serum antimycobacterial drug levels in non-HIV-infected tuberculosis patients. Chest. 1998;113:1178-83.
- [Google Scholar]
- Serum concentrations of antimycobacterial drugs in patients with pulmonary tuberculosis in Botswana. Clin Infect Dis. 2005;41:461-9.
- [Google Scholar]
- Determinants of rifampin, isoniazid, pyrazinamide, and ethambutol pharmacokinetics in a cohort of tuberculosis patients. Antimicrob Agents Chemother. 2006;50:1170-7.
- [Google Scholar]
- Low isoniazid concentrations and outcome of tuberculosis treatment with once-weekly isoniazid and rifapentine. Am J Respir Crit Care Med. 2003;167:1341-7.
- [Google Scholar]
- Association between acquired rifamycin resistance and the pharmacokinetics of rifabutin and isoniazid among patients with HIV and tuberculosis. Clin Infect Dis. 2005;40:1481-91.
- [Google Scholar]
- Low serum concentrations of anti-tuberculosis drugs and determinants of their serum levels. Int J Tuberc Lung Dis. 2007;11:972-8.
- [Google Scholar]
- Decreased bioavailability of rifampin and other antituberculosis drugs in patients with advanced human immunodeficiency virus disease. Antimicrob Agents Chemother. 2004;48:4473-5.
- [Google Scholar]
- Therapeutic drug monitoring in the treatment of tuberculosis. Drugs. 2002;62:2169-83.
- [Google Scholar]
- Utility of rifampin blood levels in the treatment and follow-up of active pulmonary tuberculosis in patients who were slow to respond to routine directly observed therapy. Chest. 2001;120:1520-4.
- [Google Scholar]
- Therapeutic drug monitoring for slow response to tuberculosis treatment in a state control program, Virginia, USA. Emerg Infect Dis. 2010;16:1546-53.
- [Google Scholar]
- Pharmacokinetics of thrice-weekly rifampicin, isoniazid and pyrazinamide in adult tuberculosis patients in India. Int J Tuberc Lung Dis. 2016;20:1236-41.
- [Google Scholar]
- Risk factors associated with default, failure and death among tuberculosis patients treated in a DOTS programme in Tiruvallur district, South India, 2000. Int J Tuberc Lung Dis. 2002;6:780-8.
- [Google Scholar]
- A validated high performance liquid chromatography method for the determination of rifampicin and desacetyl rifampicin in plasma and urine. Indian J Pharmacol. 2004;36:231-3.
- [Google Scholar]
- Simple and rapid liquid chromatography method for simultaneous determination of isoniazid and pyrazinamide in plasma. SAARC J TB Lung Dis HIV/AIDS. 2012;9:13-8.
- [Google Scholar]
- Food significantly reduces plasma concentrations of first-line anti-tuberculosis drugs. Indian J Med Res. 2017;145:530-5.
- [Google Scholar]
- Therapeutic drug monitoring in the treatment of tuberculosis: An update. Drugs. 2014;74:839-54.
- [Google Scholar]


