
Translate this page into:
Derivation & validation of glycosylated haemoglobin (HbA1c) cut-off value as a diagnostic test for type 2 diabetes in south Indian population
Reprint requests: Dr Alladi Mohan, Department of Medicine, Sri Venkateswara Institute of Medical Sciences, Tirupati 517 507, Andhra Pradesh, India e-mail: alladimohan@svims.gov.in
-
Received: ,
This is an open access article distributed under the terms of the Creative Commons Attribution-NonCommercial-ShareAlike 3.0 License, which allows others to remix, tweak, and build upon the work non-commercially, as long as the author is credited and the new creations are licensed under the identical terms.
This article was originally published by Medknow Publications & Media Pvt Ltd and was migrated to Scientific Scholar after the change of Publisher.
Abstract
Background & Objectives:
Glycosylated haemoglobin (HbA1c) has been in use for more than a decade, as a diagnostic test for type 2 diabetes. Validity of HbA1c needs to be established in the ethnic population in which it is intended to be used. The objective of this study was to derive and validate a HbA1c cut-off value for the diagnosis of type 2 diabetes in the ethnic population of Rayalaseema area of south India.
Methods:
In this cross-sectional study, consecutive patients suspected to have type 2 diabetes underwent fasting plasma glucose (FPG) and 2 h post-load plasma glucose (2 h-PG) measurements after a 75 g glucose load and HbA1c estimation. They were classified as having diabetes as per the American Diabetes Association criteria [(FPG ≥7 mmol/l (≥126 mg/dl) and/or 2 h-PG ≥11.1 mmol/l (≥200 mg/dl)]. In the training data set (n = 342), optimum cut-off value of HbA1c for defining type 2 diabetes was derived by receiver-operator characteristic (ROC) curve method using oral glucose tolerance test results as gold standard. This cut-off was validated in a validation data set (n = 341).
Results:
On applying HbA1c cut-off value of >6.3 per cent (45 mmol/mol) to the training data set, sensitivity, specificity, positive predictive value (PPV) and negative predictive value (NPV) for diagnosing type 2 diabetes were calculated to be 90.6, 85.2, 80.8 and 93.0 per cent, respectively. When the same cut-off value was applied to the validation data set, sensitivity, specificity, PPV and NPV were 88.8, 81.9, 74.0 and 92.7 per cent, respectively, although the latter were consistently smaller than the proportions for the training data set, the differences being not significant.
Interpretation & conclusions:
HbA1c >6.3 per cent (45 mmol/mol) appears to be the optimal cut-off value for the diagnosis of type 2 diabetes applicable to the ethnic population of Rayalaseema area of Andhra Pradesh state in south India.
Keywords
Cut-off value
diagnosis
fasting plasma glucose
glycosylated haemoglobin
oral glucose tolerance test
type 2 diabetes

Type 2 diabetes is a chronic non-communicable disease whose prevalence is showing an alarming escalating trend in both developed and developing countries1. If unrecognized or left untreated, it may lead to serious complications resulting in diabetic nephropathy, neuropathy, retinopathy and cardiovascular diseases, causing not only significant morbidity but also major economic consequences23. It has been reported that improved glycaemic control can reduce the development and/or progression of disease and its complications. Hence, screening for an early diagnosis of type 2 diabetes is of paramount importance23.
The traditional approach of diagnosis of type 2 diabetes using blood glucose estimation is hampered by several limitations such as high intra-individual biological variability (4-14%), pre-analytical variability due to fall of glucose levels in samples at room temperature, effect of lifestyle measures such as exercise, calorie restriction and difficulty in ensuring a strict fasting state before blood glucose measurement, among others34. For more than a decade, glycosylated haemoglobin (HbA1c) has been used for monitoring glycaemic control in patients with type 2 diabetes. HbA1c has been incorporated as a diagnostic test for type 2 diabetes by the American Diabetes Association (ADA)5 as it has the advantages of not requiring a fasting state for obtaining the blood sample and having a significantly less analytical variability (<2 %). However, validity of HbA1c needs to be established in the ethnic population, in which it is intended to be used as a diagnostic test for type 2 diabetes. The present study was undertaken to derive and validate a cut-off value for HbA1c for the diagnosis of type 2 diabetes in the ethnic population of Rayalaseema area in Andhra Pradesh, south India.
Material & Methods
To estimate the sensitivity with a precision of 7 per cent, we needed to study 125 patients with newly diagnosed type 2 diabetes. It was therefore, planned to study 150 patients with newly diagnosed type 2 diabetes. To estimate the specificity of 85 per cent with a precision of five per cent with 95 per cent confidence interval (CI), we needed to study 196 participants who did not have type 2 diabetes; it was planned to study 200 individuals without type 2 diabetes.
From March 2011 to August 2012, consecutive adult patients hailing from Chittoor, Kadapa, Kurnool and Anantapur districts of Rayalaseema area of Andhra Pradesh, India, suspected to have type 2 diabetes attending the Medicine and Endocrinology outpatient departments of Sri Venkateswara Institute of Medical Sciences, Tirupati, a tertiary care teaching hospital, underwent screening for inclusion in the study. Patients under 20 yr of age, those already known to have type 2 diabetes, pregnant women, seriously ill patients, patients with significant comorbid conditions, patients likely to have a secondary cause of type 2 diabetes, such as those receiving corticosteroid treatment among others, and those unwilling to participate in the study were excluded.
Sample size calculations were done using nMaster® software (Version 2) (Copyright© Department of Biostatistics, CMC, Vellore, Tamil Nadu, India). The training data set consisted of 342 patients, and 341 patients were studied in the validation data set.
The study was approved by the Institutional Ethics Committee. Written informed consent was obtained from all patients participating in the study. A detailed history was obtained from all the patients, and a thorough physical examination was carried out. Socio-economic status of the patients was recorded and categorized as per the updated Kuppuswamy's socioeconomic scale6; the income cut-offs were updated considering 2001 as the base year, using the All India Consumer Price Index for industrial workers as in February 2010 as described by Mishra and Singh7. Weight was measured (in kilograms) on a beam balance. Height was recorded using a stadiometer with head held in Frankfurt plane to the nearest of 0.1 cm. Blood pressure was recorded with a sphygmomanometer with the patient in the sitting position after five min of rest. Hypertension was defined as per the Joint National Committee VII classification8.
All patients suspected to have type 2 diabetes were screened using the standard oral glucose tolerance test (OGTT) with 75 g anhydrous glucose5. The fasting plasma glucose (FPG) and 2 h plasma glucose (2h-PG) were estimated using the glucose oxidase method (Autoanalyser CX9; Beckman Coulter, CA, USA). The intra- and inter-assay coefficients of variation (CVs) for the OGTT assay ranged from 1.7 to 2.8 per cent. Type 2 diabetes and pre-diabetes conditions were diagnosed by carrying out an OGTT as per the ADA position statement 20105 and were classified as having type 2 diabetes [FPG ≥126 mg/dl (7 mmol/l) and/or 2 h-PG ≥200 mg/dl (11.1 mmol/l)]; impaired fasting glucose (IFG) [FPG 100 mg/dl (5.6 mmol/l) to 125 mg/dl (6.9 mmol/l)]; or impaired glucose tolerance (IGT) [2-h PG of 140 mg/dl (7.8 mmol/l) to 199 mg/dl (11.0 mmol/l)].
HbA1c levels were estimated by the Bio-Rad D10 system (Bio-Rad, USA) functioning on high-performance liquid chromatography (HPLC)-based ion exchange chromatography. The Bio-Rad machine conforms to the National Glycohemoglobin Standardization Program (NGSP) standardized to the Diabetes Control and Complications Trial (DCCT)9. The CV for the HbA1c assay for normal was 1.16 per cent, and for type 2 diabetes, it was 1.22 per cent. HbA1c values were dually reported as per cent (mmol/mol) using the NGSPs HbA1c converter (http://www.ngsp.org/convert1.asp). Serum total cholesterol, triglycerides and high-density lipoprotein (HDL) were measured using Autoanalyzer CX9 (Beckman Coulter, USA). The serum LDL level was calculated using the Friedwald's formula10.
Statistical analysis: Data were recorded on a pre-designed proforma and managed using Microsoft Excel 2007 (Microsoft Corp, USA). Descriptive statistics for the categorical variables were performed by computing the frequencies (percentages) in each category. For the quantitative variables, approximate normality of the distribution was assessed. Variables following normal distribution were summarized by mean and standard deviation (SD); the remaining variables were summarized as median [interquartile range (IQR)]. The association between two categorical variables was tested by Chi-square (χ2) test. Student's t test was used to compare continuous variables between the groups. All tests were two-tailed.
Defining HbA1c cut-off value: On the basis of the OGTT results5, the patients in the training data set (n = 342) were categorized as having type 2 diabetes. The optimum cut-off value of HbA1c for defining type 2 diabetes was derived in the training data set by receiver-operator characteristic (ROC) curve method11. The HbA1c measurements in patients with and without newly diagnosed type 2 diabetes were used to derive the appropriate cut-off value of HbA1c for diagnosing type 2 diabetes that would be applicable for the ethnic population studied. The sensitivity, specificity, positive predictive value (PPV) and negative predictive value (NPV) for the cut-off value were calculated.
Validation of the derived HbA1c cut-off level: The validity of the HbA1c cut-off value derived from the training data set was assessed in a validation data set of patients who had undergone OGTT and HbA1c measurement by considering the categorization based on the OGTT results as per the ADA 2010 position statement5 as the gold standard and applying the HbA1c cut-off and calculating the sensitivity, specificity, PPV and NPV for this cut-off value. The sensitivity, specificity, PPV and NPV obtained for the HbA1c cut-off value in the training and validation data sets were compared using χ2] test. Thus, derived HbA1c cut-off was also applied to patients who had undergone FPG testing and HbA1c measurement only to assess the additional diagnostic pick up of this cut-off.
Error in judgement of the HbA1c (%) cut-off: The sensitivity (%, denoted by ξ) and specificity (%, denoted by ς) data were further analysed to locate the point on the ROC curve that was closest to the ideal value (100 % for each) by plotting a graph with the HbA1c per cent on the X-axis and error in judgement on the Y-axis. The error in judgement (%E) was calculated as the distance between a given HbA1c cut-off yield and the desired set point using the closest to (0,1) method12. Mathematically, it can be written as follows:
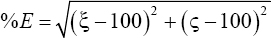
This cut-off value (%E) yields the least root mean square error in judgement. The HbA1c cut-off value at which %E is minimum could point to the least error in judgement.
Statistical software IBM SPSS, Version 20, (IBM SPSS Statistics, USA), Systat 12, Version 12.00.08 (Systat Software, Inc., USA) and MedCalc Version 11.3.0 for Windows 2000/XP/Vista/7 (MedCalc Software bvba, Belgium) were used for statistical analysis.
Results
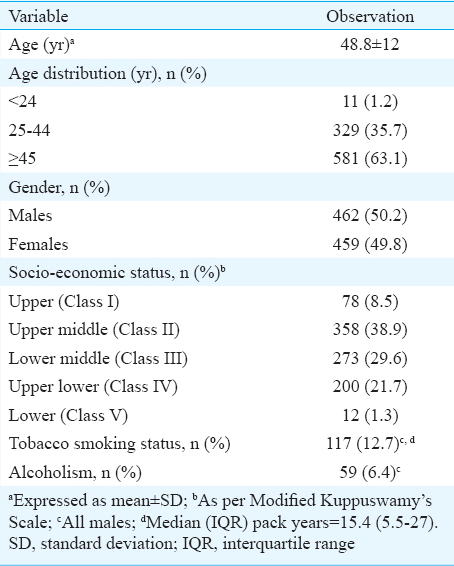
During the study period, 1230 patients were considered for inclusion in the study. Of these, 309 patients were excluded due to various reasons. The remaining 921 patients satisfying the inclusion criteria were studied (Fig. 1). Their demographic characteristics are shown in Table I. Their mean age was 48.8 ± 12 yr; there were 462 males. Majority were in their fourth decade of life. Major comorbid conditions present at the time of initial evaluation included hypertension (n = 584; 63.4 %), chronic kidney disease (n = 6) and coronary artery disease (n = 10). Based on the National Cholesterol Education Programme (NCEP) Adult Treatment Panel III,13 low HDL (90.8%) was the most frequently observed abnormality followed by hypercholesterolemia (70.7%). Hypertriglyceridemia (41%) was also found in a considerable number of patients. In 12 per cent of the patients, high serum LDL levels were observed.
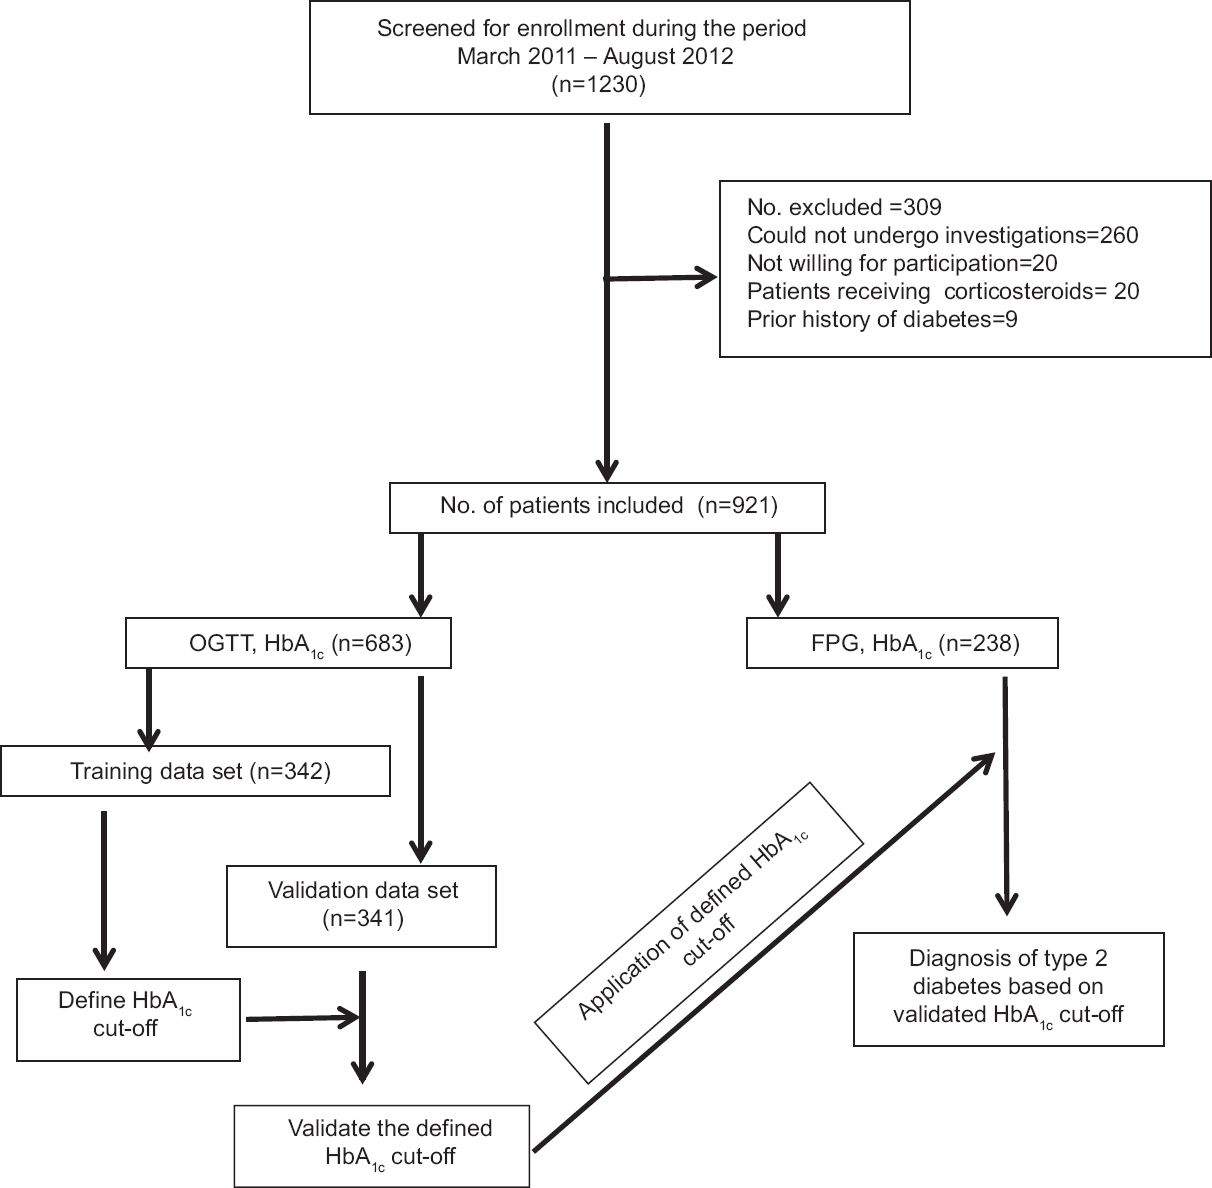
- Flow chart showing study design. OGTT = Oral glucose tolerance test; FPG = Fasting plasma glucose; HbA1c = Glycosylated haemoglobin.
The OGTT results (n = 683) were normal in 255 (37.3%) patients, 264 patients (38.7%) were found to have newly diagnosed type 2 diabetes and pre-diabetes conditions were present in 164 (24%) patients [both IFG and IGT (n = 65, 9.5%); IGT (n = 50, 7.3%) followed by IFG (n = 49, 7.1%)].
As per the updated Kuppuswamy classification67, most of the patients (n=358, 38.9%) belonged to the upper (Class II) and lower-middle class (Class III) (n=273, 29.6%) (Table I). Patients with newly diagnosed type 2 diabetes were significantly older compared with those without (mean age 51.4 ± 11.1 vs. 45.4 ± 12.1 yr; P < 0.001). Men outnumbered women among patients with newly diagnosed type 2 diabetes.
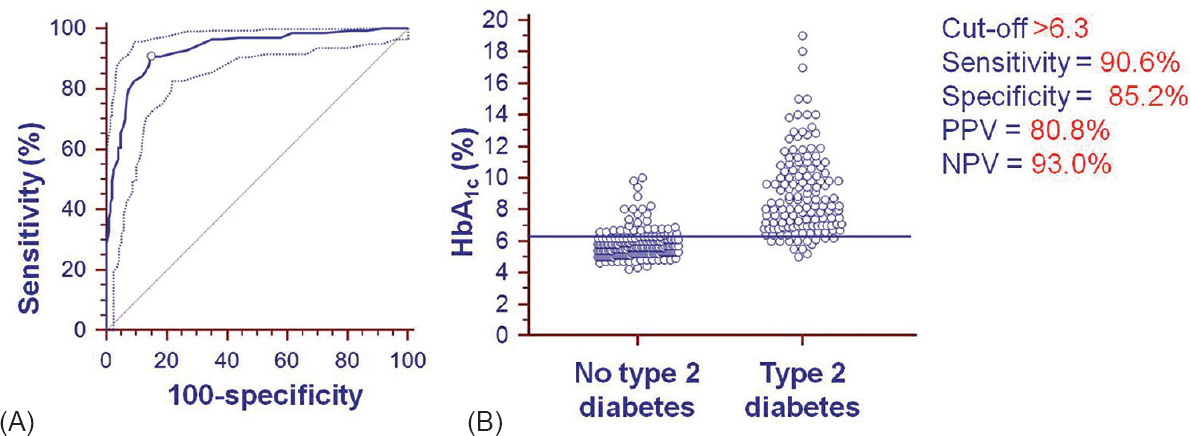
Of the 921 patients, 683 had undergone OGTT and HbA1c measurement; the initial 342 patients constituted the training data set and the remaining 341 patients constituted the validation data set. The remaining 238 patients had either provided samples for FPG and HbA1c measurement only (n = 106) or had provided samples for FPG, post-prandial blood glucose and HbA1c (n = 139) measurement instead. The ROC curve for calculating the optimal cut-off value of HbA1c for the diagnosis of type 2 diabetes in training data set (n = 342) and the interactive dot diagram for HbA1c values are shown in Fig. 2. On categorizing the patients in the training data set (n = 342) using OGTT (gold standard) results and applying the HbA1c cut-off value of >6.3 per cent (45 mmol/mol) derived by ROC method, the sensitivity, specificity, PPV and NPV were 90.6, 85.2, 80.8 and 93.0 per cent, respectively (Tables I and II).
-
(A) Receiver-operator characteristic (ROC) curve along with 95 per cent confidence bounds for calculating the cut-off value for glycosylated haemoglobin for the diagnosis of type 2 diabetes using oral glucose tolerance test as gold standard. The area under the ROC curve = 0.930; standard error = 0.0143; 95 per cent confidence interval = 0.898-0.955; Z-statistic = 30.180; significance level P (area = 0.5) = 0.0001. (B) Interactive dot diagram for glycosylated haemoglobin (HbA1c) values observed in training data set patients with newly diagnosed type 2 diabetes and those without type 2 diabetes, diagnosed based on oral glucose tolerance test. The horizontal line depicts the cut-off value. PPV = Positive predictive value; NPV = Negative predictive value.
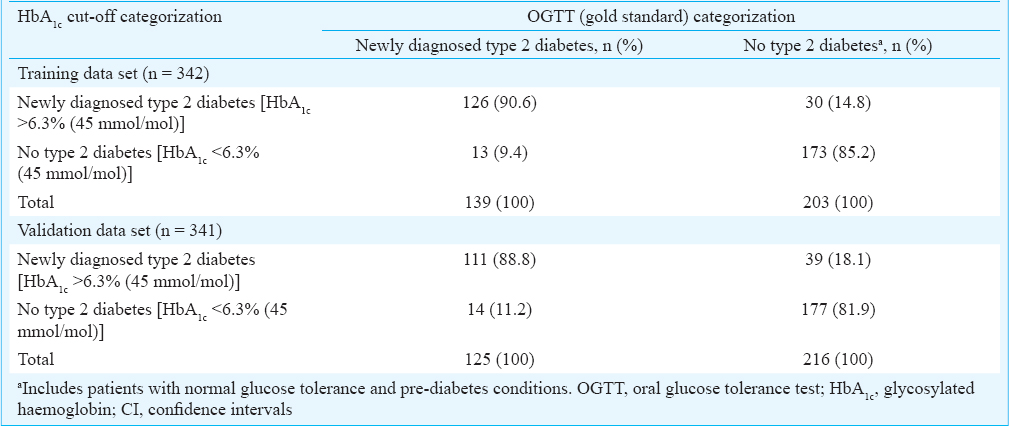
When the HbA1c cut-off of >6.3 per cent (45 mmol/mol) thus derived was applied to the validation data set (n = 341), it yielded a sensitivity, specificity, PPV and NPV of 88.8, 81.9, 74.0 and 92.7 per cent, respectively (Table III). On comparing the training data set and validation data sets, the sensitivity, specificity, PPV and NPV of the HbA1c cut-off observed in the validation data set were consistently smaller than the proportions for the training data set, but the differences were not significant.
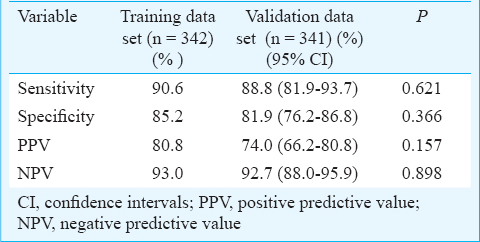
Figure 3 shows the specificity (%) and sensitivity (%) with the HbA1c per cent and error in judgement (%E) shown as the inset. The error in judgement (%E) (mean 17.49; 95% CI 11.4-25.6) was the least at the HbA1c cut-off value of >6.3 per cent (45 mmol/mol).
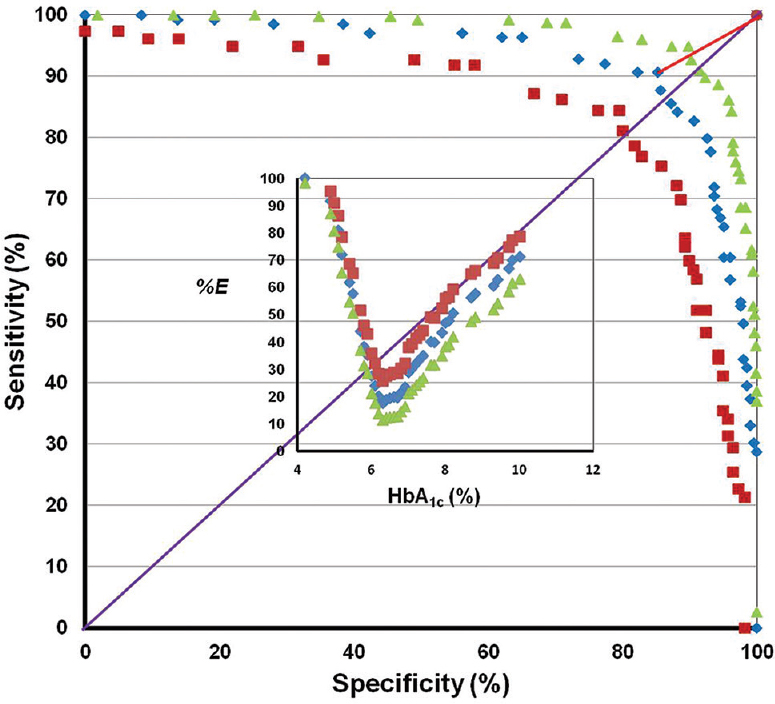
- Graph plotted with specificity (%) on the X-axis and sensitivity (%) on the Y-axis along with 95 per cent confidence bands. The ideal sensitivity and specificity are indicated by the line that would begin in the lower left corner, go straight up to the upper left corner and then to the upper right corner (i.e., with 100% sensitivity and 100% specificity). The diagonal line, which bisects the graph with the area under this curve of 0.5, indicates that the test is uninformative/worthless. The line connecting the derived optimal glycosylated haemoglobin cut-off (glycosylated haemoglobin >6.3; sensitivity 90.6%, specificity 85.2%) and the ideal cut-off (sensitivity 100%, specificity 100%) is also shown. The inset shows the graph with the glycosylated haemoglobin (%) on the X-axis and error in judgement (%E) (with 95% confidence bands) on the Y-axis.
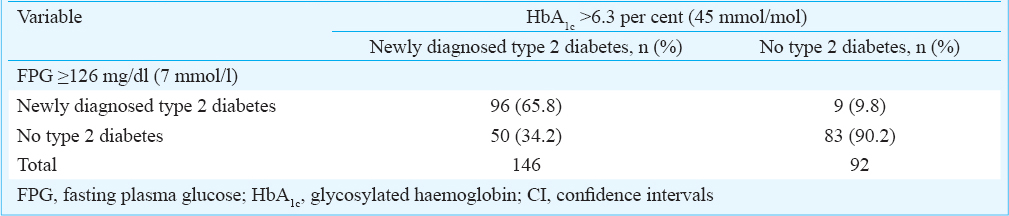
The validated HbA1c cut-off value [ > 6.3% (45 mmol/mol)] was also applied to the individuals who had not undergone OGTT, in whom only FPG values were available (n = 238). The validated HbA1c cut-off picked up an additional 50 cases of newly diagnosed type 2 diabetes and missed nine cases categorized as newly diagnosed type 2 diabetes by the FPG cut-off criteria (Table IV).
Discussion
Several studies have computed different HbA1c cut-off values for diagnosing diabetes mellitus based on OGTT ranging from ≥5.6 per cent (38 mmol/mol) to ≥7.0 per cent (53 mmol/mol)14151617181920. Several factors such as age, ethnicity, genetic makeup, erythrocyte lifespan and erythrocyte environment, which can influence glycosylation of haemoglobin2122232425, are likely to have contributed to these differences. As India is a country with varied ethnic diversity, an attempt was made in this study to elucidate the reliable cut-off value of HbA1c for the diagnosis of type 2 diabetes in ethnic population of Rayalaseema area of Andhra Pradesh State in southern India. Majority of the patients diagnosed were in their fourth and fifth decades of life; men were more often affected than women. These observations reflected the demographic characters documented in other published studies on newly diagnosed type 2 diabetes from India26272829. Observations from the present study revealed that only 48 per cent of the patients with type 2 diabetes belonged to the upper- and upper-middle classes. Moreover, 30 per cent of the patients belonged to lower-middle class and 23 per cent belonged to upper-lower and lower-classes. These findings suggest that in Rayalaseema area, type 2 diabetes is not only a disease of the rich alone but also affects the middle- and lower-classes as well. In the present hospital-based study, more than one-third of the patients were found to have newly diagnosed type 2 diabetes. This figure was higher compared to observations reported in a community-based study from north India28 and south India27, where the prevalence of newly diagnosed type 2 diabetes was found to be 6.7 and 10.4 per cent, respectively. Whether this higher prevalence is due to differences in the criteria chosen to define diabetes in the other studies26272829, selection bias inherent in a hospital-based study, or whether it reflects the real scenario in the community in Rayalaseema area of Andhra Pradesh merits further evaluation.
Even though four previously published studies26272829 from India have attempted to define the optimal HbA1c cut-off value for the diagnosis of type 2 diabetes, these observations have not been validated subsequently. In the present study the cut-off value derived in the training data set was subsequently validated in the validation data set and the sensitivity, specificity, PPV and NPV observed in the training and validation data set were comparable. The HbA1c cut-off of >6.3 per cent (45 mmol/mol) derived in the present study compared well with the corresponding figures reported in other published studies1314151617181925262728. When the HbA1c cut-off value was applied to the individuals who had not undergone OGTT such as those in whom FPG values were available, it picked up an additional 50 cases and missed nine cases who were diagnosed by the FPG cut-off criteria. These observations suggest that this cut-off value has the potential to be useful in the ethnic population of Rayalaseema area.
In the present study, the optimal HbA1c cut-off value for the diagnosis of type 2 diabetes was >6.3 per cent (45 mmol/mol). Given that the HbA1c results are presently expressed in increments of 0.1, this can also be expressed as ≥6.4 per cent (46 mmol/mol). This cut-off value was similar to the reported optimal HbA1c cut-off value of 6.2 per cent (44 mmol/mol) described in the UKPDS2 and 6.1 per cent (43 mmol/mol) described in the DCCT3 and the study from Chennai, Tamil Nadu, South India27 However, this cut-off was higher than that reported in the study29 from New Delhi [5.8% (40 mmol/mol)]. These differences could possibly be due to differences in the ethnicity and assay methods employed for measuring HbA1c.
Analysis of data from the National Health and Nutrition Examination Survey data suggested that a HbA1c cut-off value of ≥6.5 per cent (48 mmol/mol) identified one-third fewer cases of undiagnosed diabetes than an FPG cut-off value of ≥7 mmol/l (≥126 mg/dl)5. Hence, further research is needed to better characterize those patients whose glycaemic status might be categorized differently by two different tests (e.g., FPG and HbA1c), obtained in close temporal approximation. Such type of discordance may arise from measurement variability, changeover time or because of the fact that each value of HbA1c, FPG and 2h-PG on OGTT measure a different physiological processes. In the setting of an elevated HbA1c but non-diabetes FPG, the likelihood of greater 2h-PG levels or increased glycation rates for a given degree of hyperglycaemia may be present. When FPG is high, but HbA1c is below the diabetes cut-off value, augmented hepatic glucose production or reduced glycation rates may be present5.
Conclusions
In conclusion, a cut-off value of HbA1c >6.3 per cent (45 mmol/mol) appears to be the optimal cut-off value for the diagnosis of type 2 diabetes applicable to the ethnic population of the Rayalaseema area of Andhra Pradesh State in south India. The sensitivity of HbA1c in the training and validation data sets was about 90 per cent, indicating that most patients with type 2 diabetes would be detected. However, the specificity was about 85 per cent which indicated that about 15-20 per cent of patients without type 2 diabetes would be wrongly labelled as having type 2 diabetes and would probably be started on unnecessary medication. While this may be resolved in a hospital-based situation on follow up of the patients, if HbA1c is used as the diagnostic test in prevalence surveys of type 2 diabetes in the general population, the actual number of such misclassifications could be large. Therefore, it would not be advisable to replace the OGTT by HbA1c as a diagnostic test for type 2 diabetes in the prevalence surveys in the general population.
Acknowledgment
The study was funded by Sri Balaji Arogya Vara Prasadini Scheme of Sri Venkateswara Institute of Medical Sciences and Tirumala Tirupati Devasthanams, Tirupati. The authors thank Dr L. Jeyaseelan, Professor, Department of Statistics, Christian Medical College, Vellore, for help and guidance with sample size calculations. A part of this work was presented at APICON 2013, the 68th Annual Conference of the Association of Physicians of India held at Coimbatore (January 31 - February 3, 2013).
Conflicts of Interest: None.
References
- 2015. International Diabetes Federation. The IDF Diabetes Atlas. (7th ed). Belgium: International Diabetes Federation; Available from: http://www.diabetesatlas.org/
- Intensive blood-glucose control with sulphonylureas or insulin compared with conventional treatment and risk of complications in patients with type 2 diabetes (UKPDS 33). UK Prospective Diabetes Study (UKPDS) Group. Lancet. 1998;352:837-53.
- [Google Scholar]
- The effect of intensive treatment of diabetes on the development and progression of long-term complications in insulin-dependent diabetes mellitus. The Diabetes Control and Complications Trial Research Group. N Engl J Med. 1993;329:977-86.
- [Google Scholar]
- International Expert Committee. International Expert Committee report on the role of the A1C assay in the diagnosis of diabetes. Diabetes Care. 2009;32:1327-34.
- [Google Scholar]
- American Diabetes Association. Diagnosis and classification of diabetes mellitus. Diabetes Care. 2010;33(Suppl 1):S62-9.
- [Google Scholar]
- Manual of socioeconomic status (Urban). New Delhi: Manasayan; 1981.
- Kuppuswamy's socioeconomic status scale - A revision. Indian J Pediatr. 2003;70:273-4.
- [Google Scholar]
- Seventh report of the Joint National Committee on Prevention, Detection, Evaluation, and Treatment of High Blood Pressure. Hypertension. 2003;42:1206-52.
- [Google Scholar]
- The DCCT Research Group. The relationship of glycemic exposure (HbA 1 c) to the risk of development and progression of retinopathy in the diabetes control and complications trial. Diabetes. 1995;44:968-83.
- [Google Scholar]
- Estimation of the concentration of low-density lipoprotein cholesterol in plasma, without use of preparative ultracentrifuge. Clin Chem. 1972;18:499-502.
- [Google Scholar]
- Receiver operating characteristic (ROC) curve for medical researchers. Indian Pediatr. 2011;48:277-87.
- [Google Scholar]
- The inconsistency of “optimal” cutpoints obtained using two criteria based on the receiver operating characteristic curve. Am J Epidemiol. 2006;163:670-5.
- [Google Scholar]
- National Cholesterol Education Program (NCEP) Expert Panel on Detection, Evaluation, and Treatment of High Blood Cholesterol in Adults (Adult Treatment Panel III). Third report of the national cholesterol education program (NCEP) expert panel on detection, evaluation, and treatment of high blood cholesterol in adults (Adult Treatment Panel III) final report. Circulation. 2002;106:3143-421.
- [Google Scholar]
- Validity of glycated hemoglobin in screening and diagnosing type 2 diabetes mellitus in Chinese subjects. Korean J Intern Med. 2012;27:41-6.
- [Google Scholar]
- HbA1c of 6.5% to diagnose diabetes mellitus? Does it work for us? The Bellville South Africa study. PLoS One. 2011;6:e22558.
- [Google Scholar]
- Utility of HbA(1c) levels for diabetes case finding in hospitalized patients with hyperglycemia. Diabetes Care. 2003;26:1064-8.
- [Google Scholar]
- The utility of HbA 1 c as a diagnostic criterion of diabetes. Korean J Fam Med. 2011;32:383-9.
- [Google Scholar]
- Relationship between A1C and glucose levels in the general Dutch population: the new Hoorn study. Diabetes Care. 2010;33:61-6.
- [Google Scholar]
- Glycated haemoglobin in diagnosis of diabetes mellitus and pre-diabetes among middle-aged and elderly population: Shanghai Changfeng study. Biomed Environ Sci. 2013;26:155-62.
- [Google Scholar]
- Use of hemoglobin A1C to detect Haitian-Americans with undiagnosed Type 2 diabetes. Arq Bras Endocrinol Metabol. 2012;56:449-55.
- [Google Scholar]
- The DCCT Research Group. The absence of a glycemic threshold for the development of long-term complications: the perspective of the Diabetes Control and Complications Trial. Diabetes. 1996;45:1289-98.
- [Google Scholar]
- The biosynthesis of human hemoglobin A1c. Slow glycosylation of hemoglobin in vivo. J Clin Invest. 1976;57:1652-9.
- [Google Scholar]
- Differences in A1C by race and ethnicity among patients with impaired glucose tolerance in the Diabetes Prevention Program. Diabetes Care. 2007;30:2453-7.
- [Google Scholar]
- Racial and ethnic differences in mean plasma glucose, hemoglobin A1c, and 1,5-anhydroglucitol in over 2000 patients with type 2 diabetes. J Clin Endocrinol Metab. 2009;94:1689-94.
- [Google Scholar]
- Limitations of glycosylated haemoglobin as an index of glucose intolerance. Diabetes Res Clin Pract. 2000;47:129-33.
- [Google Scholar]
- A1C cut points to define various glucose intolerance groups in Asian Indians. Diabetes Care. 2010;33:515-9.
- [Google Scholar]
- Utility of glycated hemoglobin in diagnosing type 2 diabetes mellitus: a community-based study. J Clin Endocrinol Metab. 2010;95:2832-5.
- [Google Scholar]
- HbA(1c) values for defining diabetes and impaired fasting glucose in Asian Indians. Prim Care Diabetes. 2011;5:95-102.
- [Google Scholar]


