
Translate this page into:
N-acetyltransferase 2 (NAT2) gene polymorphism as a predisposing factor for phenytoin intoxication in tuberculous meningitis or tuberculoma patients having seizures - A pilot study
Reprint requests: Dr Sadhna Sharma, Department of Biochemistry, Postgraduate Institute of Medical Education & Research, Chandigarh 160 012, India e-mail: sadhnash2001@hotmail.com
-
Received: ,
This is an open access article distributed under the terms of the Creative Commons Attribution-NonCommercial-ShareAlike 3.0 License, which allows others to remix, tweak, and build upon the work non-commercially, as long as the author is credited and the new creations are licensed under the identical terms.
This article was originally published by Medknow Publications & Media Pvt Ltd and was migrated to Scientific Scholar after the change of Publisher.
Abstract
Background & objectives:
Simultaneous administration of phenytoin and isoniazid (INH) in tuberculous meningitis (TBM) or tuberculoma patients with seizures results in higher plasma phenytoin level and thus phenytoin intoxication. N-acetyltransferase 2 (NAT2) enzyme catalyses two acetylation reactions in INH metabolism and NAT2 gene polymorphism leads to slow and rapid acetylators. The present study was aimed to evaluate the effect of allelic variants of N-acetyltransferase 2 (NAT2) gene as a predisposing factor for phenytoin toxicity in patients with TBM or tuberculoma having seizures, and taking INH and phenytoin simultaneously.
Methods:
Sixty patients with TBM or tuberculoma with seizures and taking INH and phenytoin simultaneously for a minimum period of seven days were included in study. Plasma phenytoin was measured by high performance liquid chromatography. NAT2 gene polymorphism was studied using restriction fragment length polymorphism and allele specific PCR.
Results:
The patients were grouped into those having phenytoin intoxication and those with normal phenytoin level, and also classified as rapid or slow acetylators by NAT2 genotyping. Genotypic analysis showed that of the seven SNPs (single nucleotide polymorphisms) of NAT2 gene studied, six mutations were found to be associated with phenytoin intoxication. For rs1041983 (C282T), rs1799929 (C481T), rs1799931 (G857A), rs1799930 (G590A), rs1208 (A803G) and rs1801280 (T341C) allelic variants, the proportion of homozygous mutant was higher in phenytoin intoxicated group than in phenytoin non-intoxicated group.
Interpretation & conclusions:
Homozygous mutant allele of NAT2 gene at 481site may act as a predisposing factor for phenytoin intoxication among TBM or tuberculoma patients having seizures.
Keywords
Adverse drug interaction
NAT2 gene polymorphism
phenytoin intoxication
rapid acetylator genotypes
seizures
tuberculoma
tuberculous meningitis

Central nervous system (CNS) tuberculosis (TB) is a serious, often fatal form of tuberculosis, predominantly affecting young children. Tuberculous meningitis (TBM) or tuberculoma accounts for 70 to 80 per cent cases of neurological tuberculosis1. Incidence of meningitis in patients with tuberculosis has been reported to vary from 7.4 to 11.8 per cent from various centres in India23. Seizures are a potential complication in 10-20 per cent of children, 10-15 per cent of adults and more than 50 per cent can develop seizures during their initial hospitalization45. Phenytoin is one of the most widely prescribed anti-convulsant drugs for treatment and prevention of seizures6. It is metabolized extensively by Cytochrome P450 2C9 (CYP2C9) and to small extent by CYP2C197. The narrow therapeutic index, the wide inter-individual variability in the rate of phenytoin metabolism, clearance and saturation (zero-order) pharmacokinetics of phenytoin are responsible for the observed dose-related toxicity.
Isoniazid (INH) is one of the most effective antimycobacterial drugs. Two acetylation reactions in the metabolism of INH are catalyzed by N-acetyltransferase 2 (NAT2) which shows genetic polymorphism, resulting in two distinct phenotypes, i.e. slow and rapid acetylators8. Till date, NAT2 loci have been shown to express 36 alleles, resulting from the existence of numerous single nucleotide polymorphisms (SNPs). Seven missense (G191A, T341C, A434C, G590A, A803G, A845C and G857A) and four silent (T111C, C282T, C481T and C759T) substitutions have been identified in the NAT2 coding exon. Absence of any of these substitutions is considered as the wild-type allele (rapid acetylator). NAT2 alleles containing the G191A, T341C, A434C, G590A, and/or G857A missense substitutions are associated with slow acetylator phenotype9.
INH is also a microsomal enzyme inhibitor, and inhibits the metabolism of co-administered drugs such as acetaminophen, carbamazepine, diazepam, phenytoin, theophylline and warfarin resulting in their high plasma concentration10. In TBM or tuberculoma patients with seizures, INH and phenytoin are simultaneously administered. If these patients are slow acetylators, possibility of phenytoin intoxication becomes high11.
Pharmacogenomics may enable the identification of responders, non-responders, or patients at an increased risk of toxicity in response to drug administration1213. Phenotypic assessment of acetylator status by INH pharmacokinetic study alone is not sufficient to solve the problem. It is essential to find out frequencies of the NAT2 allelic variants in patients taking INH and phenytoin simultaneously. Hence, NAT2 genotyping is recommended in larger prospective trials to elucidate the role of NAT2 genetic polymorphism in phenytoin intoxication in TBM or tuberculoma patients. Various studies141516 have shown difference in frequencies and distribution of various alleles of NAT-2 gene among Indians. We have demonstrated a correlation between the INH levels and phenytoin toxicity in TBM or tuberculoma patients in our earlier study17. Therefore, the aim of this pilot study was to elucidate whether any allelic variant of NAT2 gene acted as a predisposing factor for phenytoin toxicity in patients with TBM or tuberculoma taking INH and phenytoin simultaneously. The objectives were to determine the presence of phenytoin intoxication, to analyze seven [rs1801279 (191G-A), rs1041983 (282C-T), rs1799929 (481C-T), rs1799930 (590G-A), rs1208 (803A-G), rs1799931 (857G-A) & rs1801280 (341T-C)] alleles of NAT2 gene and to investigate association of these alleles with phenytoin intoxication in these patients.
Material & Methods
Chemicals and drugs: Sucrose, magnesium chloride (MgCl2), tris-HCl, triton-X100, sodium chloride (NaCl), ethylenediamine tetraacetic acid (EDTA), sodium dodecyl sulphate (SDS), glucose, citric acid, sodium citrate, chloroform, ethanol, agarose, glycerol, bromophenol blue, boric acid, ethidium bromide, glacial acetic acid and benzene were procured from Qualigens Fine Chemicals, Mumbai. Taq polymerase, sodium perchlorate, deoxynucleoside triphosphate were procured from Sigma Chemical Co (St. Louis, MO, USA.) Primer sequences were selected and synthesized from Sigma-Aldrich Pvt. Ltd in Bengaluru. Restriction enzymes with their respective buffers like MspI (Moraxella species), FokI (Flavobacterium okeanokoites), KpnI (Klebsiella pneumoniae OK8), BamHI (Bacillus amyloliquefaciens), DdeI (Desulfovibrio desulfuricans) and TaqI (Thermus aquaticus) were obtained from Genetix Biotech Asia Pvt. Ltd, New Delhi, India.
Study subjects: Sixty patients with TBM or tuberculoma attending the outpatients Neurology clinic, Neurology ward or Emergency ward of Nehru Hospital, Postgraduate Institute of Medical Education and Research (PGIMER), Chandigarh, India, from January to December 2009 were randomly included in this pilot study after obtaining written informed consent as described earlier12. Study protocol was approved by Institutional Review Board of PGIMER, Chandigarh.
Blood samples (5 ml) from all patients with TBM or tuberculoma were collected in sterilized tubes exactly after 180 min of drug administration because peak plasma phenytoin level would reach in 1.5 to 3 h. Of the five ml blood collected, three ml was put in tubes containing 525 µl acid citrate dextrose (ACD) (0.48% w/v citric acid: 1.32% w/v sodium citrate: 1.47% w/v glucose) as anticoagulant for genotypic analysis and two ml in heparinized tubes for plasma phenytoin estimation by high performance liquid chromatography (HPLC) as described earlier17. Total plasma phenytoin concentration was measured by Winter-Tozer equation18.
All patients were grouped into phenytoin intoxicated and phenytoin non-intoxicated as described earlier17. Therefore, the cut-off level of plasma phenytoin of 15 μg/ml was considered for grouping patients as phenytoin intoxicated and phenytoin non-intoxicated19. Patients with both clinical symptoms and a plasma phenytoin concentration more than 15 μg/ml were grouped as phenytoin intoxicated.
NAT2 genotyping and SNP selection: Genomic DNA was isolated from whole blood (3 ml)20 and stored at -20° C till further use. NAT2 polymorphism was studied using polymerase chain reaction - restriction fragment length polymorphism (PCR-RFLP), nested PCR and allele-specific PCR. Standardized protocol for amplification of NAT2 gene and RFLP for analysis of point mutations at 191(MspI), 282 (FokI), 481 (KpnI) and 857(BamHI) positions, nested PCR-RFLP for the analysis of point mutation at 590 (TaqI) and 803 positions and allelic-specific PCR for analysis of the mutational status at 314 site were performed as described earlier14. The digestion products were resolved on high efficiency agarose gel and the DNA bands were visualized by ethidium bromide staining14 (Table I).
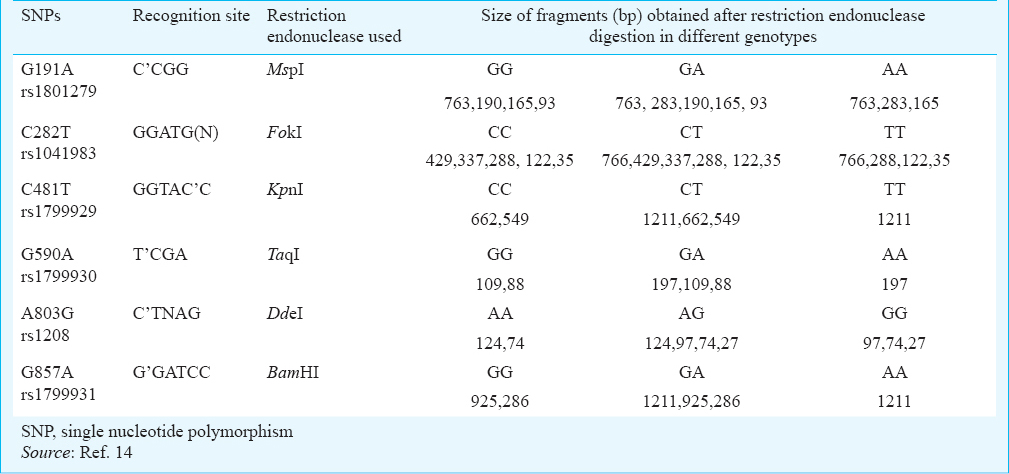
Estimating the frequency of rapid and slow acetylators: As per the band patterns given in Table I, the wild-type and mutant alleles were recorded; genotyping of NAT2 gene in the study patients was done based on this observation. Patients with wild type for all of the NAT2 polymorphisms were phenotyped as rapid acetylators and patients with homozygous mutants or heterozygous for more than one of the polymorphisms were phenotyed as slow acetylators.
Statistical analysis: Statistical analysis was performed on SPSS 16.0 software (SPSS, Inc., Chicago, USA). Differences between allelic frequencies between phenytoin intoxicated and non-toxicated groups were determined using Chi square test or Fisher's exact test. Odds ratios (OR) and 95% confidence interval (CI) were obtained by summarizing data between phenytoin intoxicated and non-intoxicated patients. Correlations of NAT-2 genotypes with mean plasma total and free phenytoin levels between phenytoin intoxicated and non-intoxicated groups were analyzed by Wilcoxon Rank Sum test.
Results
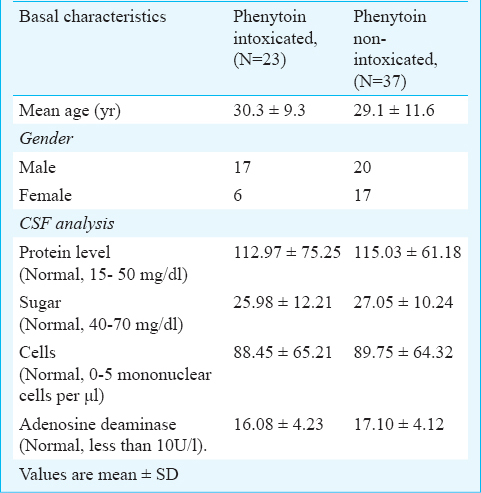
Basal characteristics of patients are shown in Table II. Of the 60 patients, 37 were males (mean age 29.23 ± 10.95 yr) and 23 females (mean age 29.33 ± 10.87 yr). Five patients were CSF culture and acid fast bacilli (AFB) positive, 45 patients were culture negative and AFB positive and 10 were culture and AFB negative. All patients included in the study revealed normal liver, kidney function tests and haematological parameters.
Phenytoin status: Of the 60 patients studied, 37 showed no signs and symptoms of phenytoin intoxication, and 23 patients exhibited phenytoin intoxication based on the citeria mentioned17.
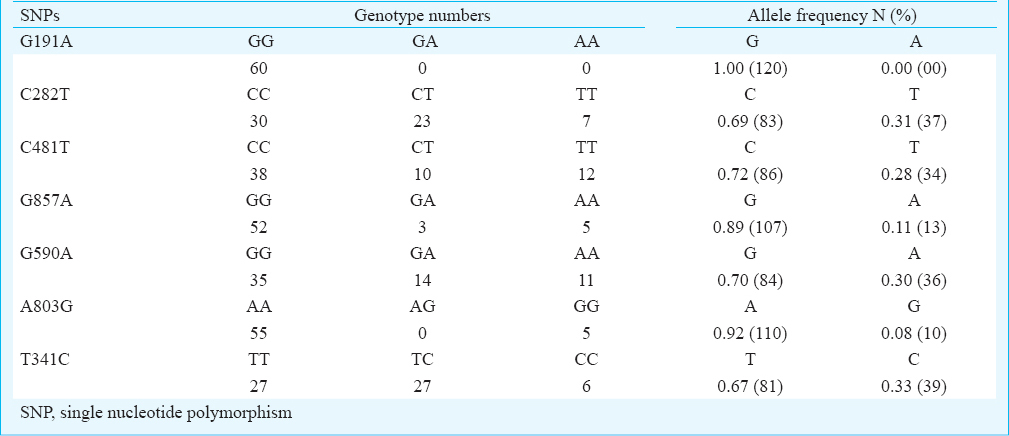
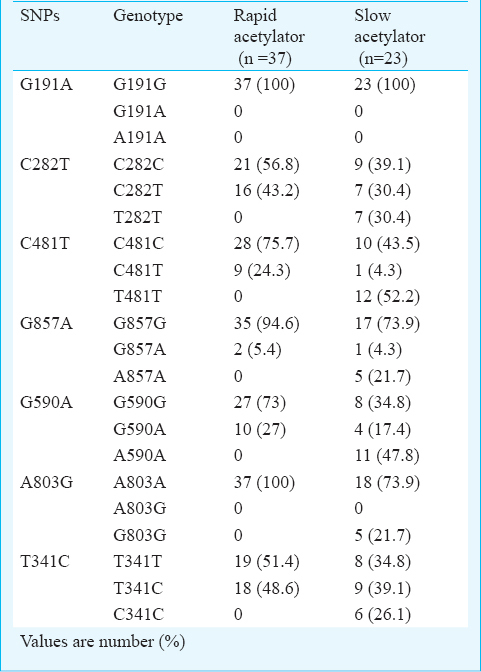
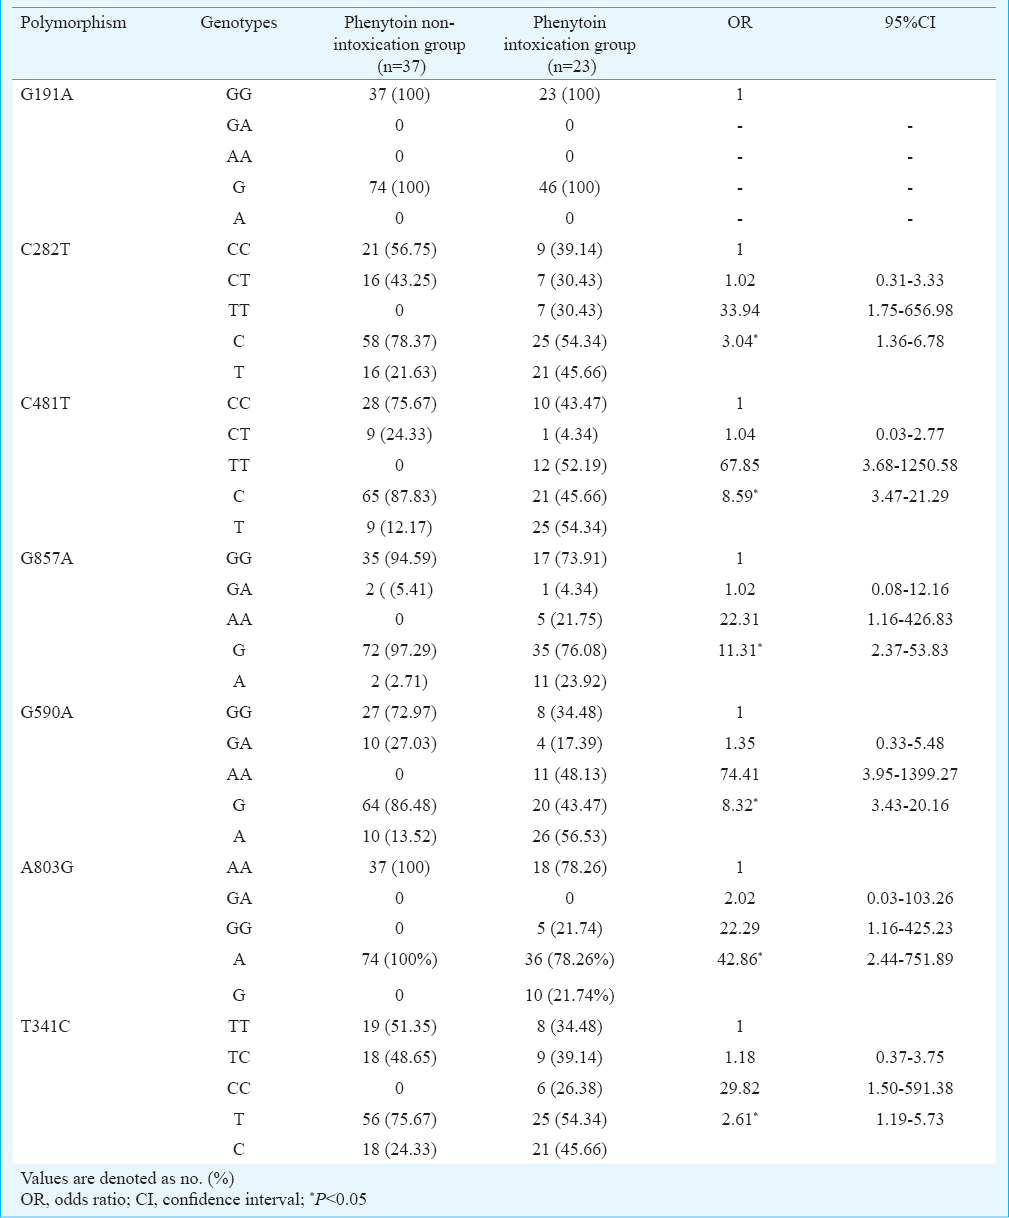
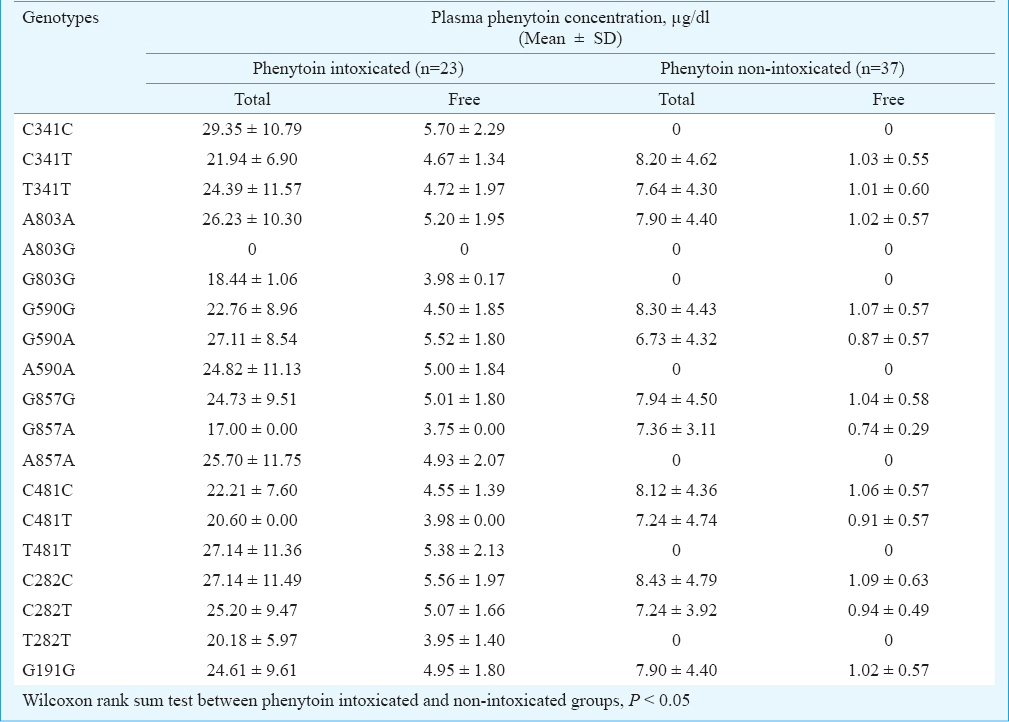
NAT2 genotyping: BLAST search (https://blast.ncbi.nlm.nih.gov/Blast.cgi?PAGE_TYPE-BlastSearch) of NAT2 sequence revealed 99 per cent identity with Homosapien NAT2 gene. NAT2 gene product matched with the nucleotide number 13716-14409 of Homosapien NAT2 gene (Accession No: NC_000008.11). NAT2 gene SNPs C282T, G590A, T341C, G191A, A803G, G857A and C481T were studied and sequence variation was identified in each case (Figs 1-5). The observed genotype frequencies satisfied the Hardy-Weinberg equilibrium for all polymorphisms studied. Distribution of homozygous wild, heterozygous and homozygous mutant SNPs among the 60 patients is shown in Table III. C481T was found to be the most predominant, whereas the mutations A803G and G857A were the least observed. No case of G191A was observed. Of the 60 patients, 38 and 45 per cent were found to be heterozygous for C282T (frequency of ‘T’ allele = 31%) and T341C (frequency of C allele = 33%) polymorphisms, respectively. Analysis of C481T and G857A revealed that the percentage of homozygous mutants i.e. TT (20%) and AA (8%) were higher as compared to heterozygous i.e. CT (17%) and GA (5%), respectively. There were 37 rapid and 23 slow acetylator phenotypes as shown in Table IV. Among slow acetylators, homozygous mutants of C282T, C481T, G857A, G590A, A803G and T341C were 30, 52, 22, 48, 22 and 26 per cent, respectively while heterozygous were 30, 4, 4, 17, 0 and 39 pe cent, respectively. Among rapid acetylators, heterozygous of C282T, C481T, G857A, G590A and T341C were 43, 24, 5, 27 and 49 per cent, respectively. The results of NAT2 genotyping among phenytoin intoxicated and non-intoxicated groups are shown in Table V. All patients with rapid acetylator status had plasma phenytoin level less than 15 µg/ml and showed no sign and symptoms of phenytoin toxicity, while all patients with slow acetylators status had plasma phenytoin level above 15 µg/ml and had signs and symptoms of phenytoin toxicity. The allelic frequencies for C282T, C481T, G857A, G590A, A803G and T341C were significantly associated with phenytoin intoxicated group as compared to non-intoxicated group [OR = 3.04 (95% CI, 1.36-6.78); OR = 8.59 (3.47-21.29); OR = 11.31 (2.37-53.83); OR = 8.32 (3.43-20.16); OR = 42.86 (2.44-751.89) and OR = 2.61 (1.19-5.73)], respectively. Mean plasma total and free phenytoin levels were significantly (P<0.05) higher in phenytoin intoxicated group compared to non-intoxicated group (Table VI).
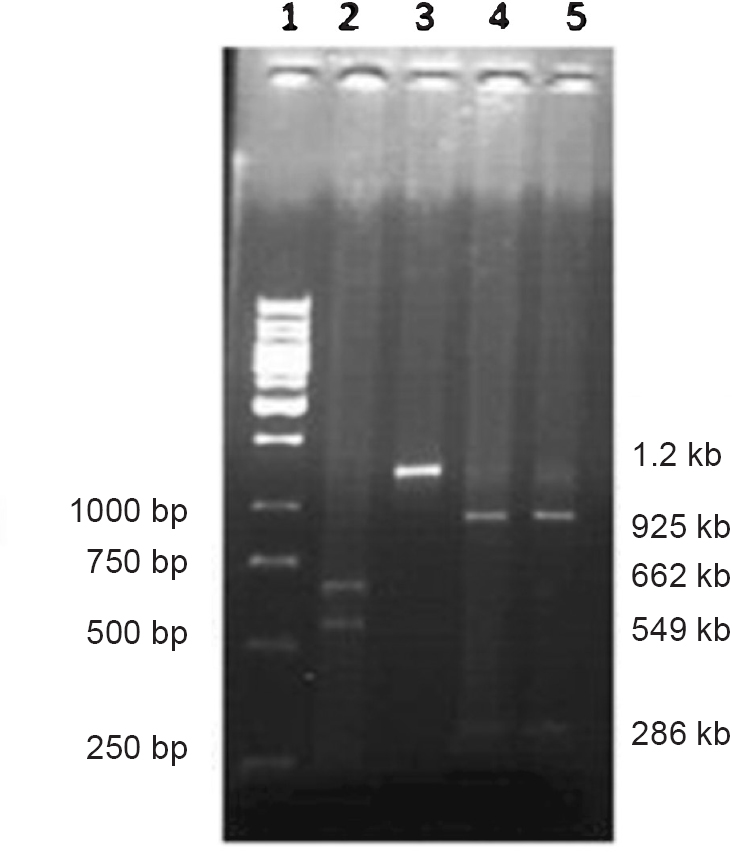
- Electrophoresis band pattern by KpnI and BamHI digestion. Lane 1: 1kb DNA ladder, lane 2: KpnI digestion (wild), lane 3: KpnI digestion (mutant), lane 4: BamHI digestion (wild), lane 5: BamHI digestion (wild).
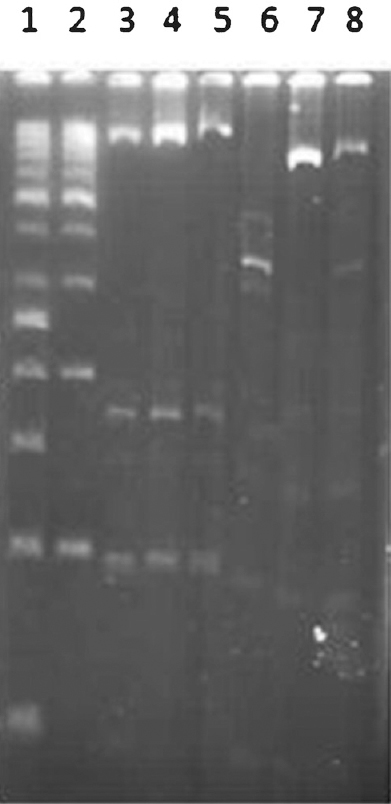
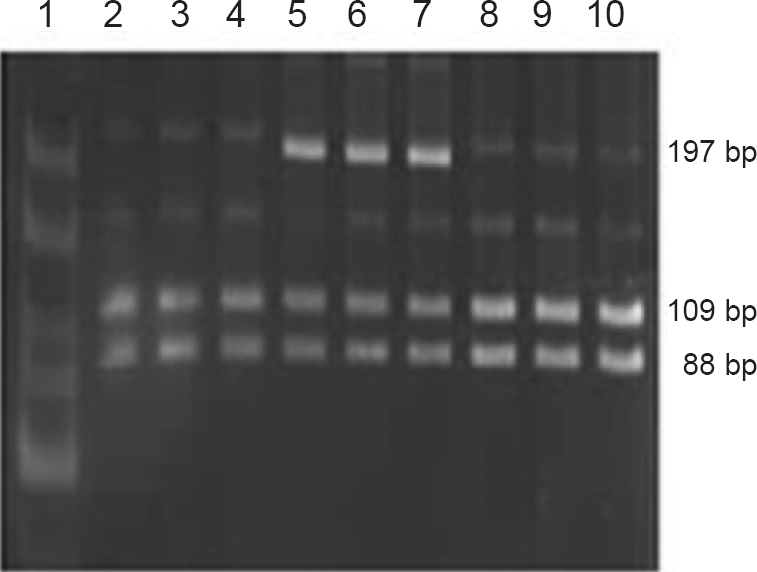
- Electrophoresis band pattern by MspI and FokI digestion. Lane 1: 50bp DNA ladder, lane 2: 100bp DNA ladder, lanes 3-5: MspI digestion (wild), lane 6: FokI digestion (wild), lane 7: FokI digestion (mutant), lane 8: FokI digestion (heterozygous).
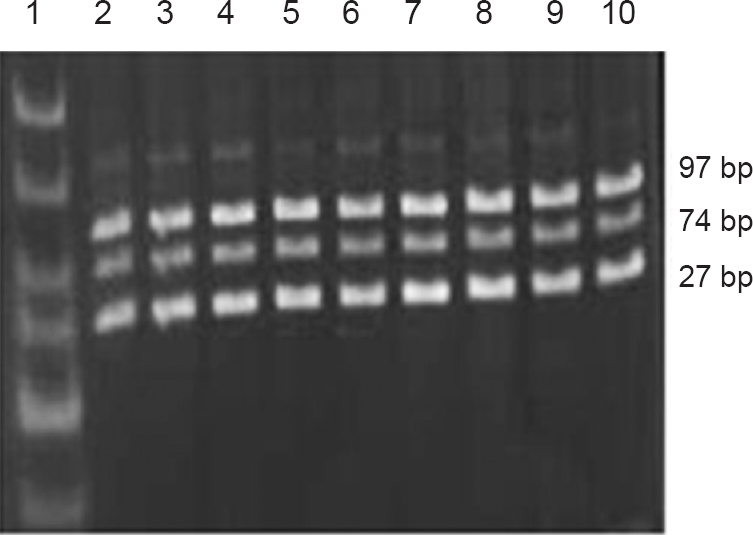
- Electrophoresis band pattern by TaqI digestion. Lane 1: 25-300bp DNA ladder, lanes 2-4: TaqI digestion (wild), lanes 5-7: TaqI digestion (heterozygous), lanes 8-10: TaqI digestion (wild).
- Electrophoresis band pattern by DdeI digestion. Lane 1: 25-300bp DNA ladder, lanes 2-10: DdeI digestion (mutant).
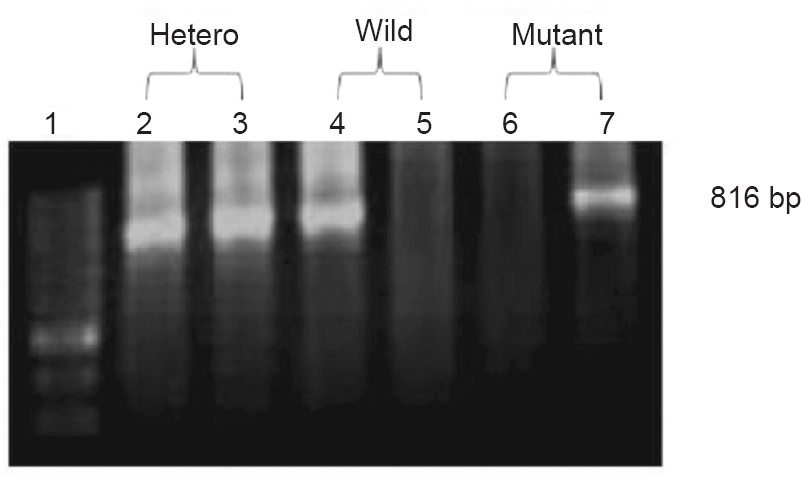
- Electrophoresis band pattern from allele-specific PCR for T341C site. Lane 1:100bp DNA ladder, lanes 2 and 3: heterozygous, lanes 4 and 5: wild, lanes 6 and 7: mutant.
Discussion
Seven SNPs of NAT2 gene at 191, 282, 590, 857, 481, 803 and 314 positions were examined in patients with TBM or tuberculoma having seizures and taking INH and phenytoin simultaneously. NAT2 genotyping among patients showed 61.66 per cent were rapid acetylators and 38.34 per cent were slow acetylators. The distribution of acetylator status was found to be similar to that found among north Indian population15. This was in contrast with another study on south Indian population, where frequency of slow acetylators was higher than rapid acetylators14. Overall, 30-40 per cent rapid acetylators and 60-70 per cent slow acetylators have been reported in India141621. The slow allele has been shown to be present in up to 90 per cent in Arab population, 40-60 per cent of Caucasians, 5-25 per cent East Asian222324 and 74 per cent in south Indians14. Percentage of slow acetylators was higher than rapid acetylators in most of the populations. The most common genotype among slow acetylators was found to be TT at 481 site. This result was consistent with another study among north Indian population25. Mutation frequencies observed in earlier studies were 30 per cent at 590 G-A, 25 per cent at 857 G-A and 50 per cent at 481C-T site among north Indian population15. In south Indian population mutation frequencies were 44 per cent at 282 C-T, 37 per cent at 590 G-A, 30 per cent at 341 T-C, 29 per cent at 803 A-G, 25 per cent at 857 G-A, 22 per cent at 481 C-T sites14. Mutation frequencies among Caucasian-American population were 45 per cent at 481 C-T, 28 per cent at 590 G-A, and 2 per cent at 857 G-A26 and among African-American population were 30 per cent at 481 C-T, 22 per cent at 590 G-A, 2 per cent at 857 G-A and 9 per cent at 191 G-A27. Also G857A variation is frequently present in Asians (12%) but rare in persons of European descent and Africans (1-2%)28; 191 G-A (R64Q) SNP is frequent in Africans and African-Americans, but virtually absent in Caucasian, Indian and Korean population. Similarly, 857 G-A (K268R) SNP is more frequent in south India and Korea than in other populations while 341 T-C (I114T) SNP is less frequent in Korea than in Europe, North America, India and Africa282930.
In the present study, genotype and allelic frequencies of NAT2 gene polymorphism at seven sites were correlated with the risk of phenytoin intoxication. Among all, 481TT was found to be the most frequent genotype among the phenytoin intoxicated patients. SNPs lead to reduction in substrate affinity, catalytic activity and/or protein stability of recombinant N-Acetyltrasferase 2 alloenzyme. Reduced activity of NAT2 protein leads to less clearance of INH. Higher INH concentration leads to more inhibition of CYP enzymes and reduced clearance of anticonvulsant drug administered simultaneously leading to its toxicity710. This was supported by a consistent rise in mean plasma total and free phenytoin levels in the phenytoin intoxicated group. Distribution of allele variants of NAT2 gene among a population decides the individual response to INH administration. Our study indicates an association of T481T allele of NAT2 gene with plasma phenytoin levels suggesting that this allele may act as a predisposing factor for the occurrence of phenytoin intoxication among patients of tuberculous meningitis or tuberculoma with seizures and taking INH and phenytoin simultaneously. Murali et al25 showed that C481T genotype of NAT2 gene was responsible for phenytoin toxicity in epileptic patients.
Pharmacogenetic analysis in TBM patients having convulsion can help understand the interaction between INH and phenytoin. It explains that with simultaneous administration of INH and phenytoin, drug dose should be manipulated according to patients NAT-2 genetic status. Those with rapid acetylator status, manipulation of drug dose can be ignored, but among slow acetylators, lower dose of phenytoin should be preferred without compromising the relief in seizures. Knowing the acetylator status by NAT2 gene analysis in TBM patients prior to treatment may result in better improvement in patient's condition with minimum drug toxicity. As this was a pilot study due to limited time and resources, small sample size was a limitation. Further, genetic status of CYP2C9 and CYP2C19 was not evaluated. In this study phenytoin metabolites were not estimated as phenytoin toxicity was only due to phenytoin per se and not due to its metabolites25.
In conclusion, rapid acetylator genotypes were comparatively predominant as compared to the slow acetylator genotypes among the patients with TBM having seizures. Slow acetylators showed significantly higher plasma phenytoin level resulting in toxicity as compared to rapid acetylators. Lethargy, dysarthria, disorientation, nystagmus and ataxia were found predominantly among phenytoin intoxicated patients. Patients with phenytoin toxicity had plasma phenytoin levels above the therapeutic level. T481T was found to be the most frequent genotype among the phenytoin intoxicated patients. Our findings suggest that T481T allele may act as a predisposing factor for the occurrence of phenytoin intoxication among patients of TBM or tuberculoma with seizures taking INH and phenytoin simultaneously.
Acknowledgment
The authors acknowledge Shyam, Shankar, Ramandeep, Nidhi, Shabir and Amandeep for their assistance with the analysis of plasma phenytoin by HPLC and genetic analysis.
Conflicts of Interest: None.
References
- Tuberculous meningitis and miliary tuberculosis: The Rich focus revisited. J Infect. 2005;50:193-5.
- [Google Scholar]
- Tuberculous meningitis in patients without systemic focus of miliary tuberculosis. Am-Eura J Sci Res. 2007;2:33-8.
- [Google Scholar]
- Estimating mortality from tuberculous meningitis in a community: use of available epidemiological parameters in the Indian context. Indian J Tuberc. 2000;47:9.
- [Google Scholar]
- Tuberculous meningitis in children during the isoniazid era. J Pediatr. 1975;87:43-9.
- [Google Scholar]
- Tuberculosis. In: Scheld WM, Whitley RJ, Durack RD, eds. Infections of the central nervous system (2nd ed). Lippincott-Raven: Philadelphia; 1997. p. :417-43.
- [Google Scholar]
- Long-term anticonvulsant therapy in tuberculous meningitis-a four-year follow-up. J Trop Pediatr. 1996;42:98-103.
- [Google Scholar]
- Mechanism of the inhibitory action of isoniazid on microsomal drug metabolism. Biochem Pharmacol. 1981;30:1651-8.
- [Google Scholar]
- Effects of N-acetyltransferase (NAT-2), CYP2E1 and glutathione-s-transferase (GST) genotype on serum concentration of isoniazid and its metabolites in tuberculosis patients. J Toxicol Sci. 2008;33:187-95.
- [Google Scholar]
- Molecular genetics and epidemiology of the NAT1 and NAT2 acetylation polymorphisms. Can Epi Bio Prev. 2000;9:29-42.
- [Google Scholar]
- Isoniazid is a mechanism-based inhibitor of cytochrome P450 1A2, 2A6, 2C19 and 3A4 isoforms in human liver microsomes. Eur J Clin Phramacol. 2002;57:799-804.
- [Google Scholar]
- Phenytoin toxicity due to concomitant antituberculosis therapy. S Afr Med J. 1995;85:1175-6.
- [Google Scholar]
- Pharmacogenomics: marshalling the human genome to individualize drug therapy. Gut. 2003;52:10-8.
- [Google Scholar]
- Pharmacogenetics in drug regulation: promise, potential and pitfalls. Philos Trans R Soc Lond B Biol Sci. 2005;360:1617-38.
- [Google Scholar]
- Aryl amine N-acetyltransferase 2 polymorphism in the ethnic population of South Indians. Int J Mol Med. 2003;11:125-31.
- [Google Scholar]
- Genetic polymorphism of the N-acetyltransferase 2 gene and susceptibility to prostate cancer: a pilot study in north Indian population. BMC Urol. 2005;5:12.
- [Google Scholar]
- Study of NAT2 gene polymorphisms in an Indian population: association with plasma isoniazid concentration in a cohort of tuberculosis patients. Mol Diagn Ther. 2009;13:49-58.
- [Google Scholar]
- Phenotypic interaction of simultaneously administered isoniazid and phenytoin in patients with tuberculous meningitis or tuberculoma having seizures. Eur J Pharmacol. 2013;714:157-62.
- [Google Scholar]
- Phenytoin. In: Evans WE, Schentag JJ, Jusko WJ, eds. Applied pharmacokinetics: principles of therapeutic drug monitoring (3rd ed). Applied Therapeutics Inc: Vancouver WA; 1992. p. :1-44.
- [Google Scholar]
- Features and management of poisoning with modern drugs used to treat epilepsy. Q J Med. 1998;91:325-32.
- [Google Scholar]
- NAT2 sequence polymorphisms and acetylation profiles in Indians. Pharmacogenomics. 2013;14:289-303.
- [Google Scholar]
- Ethnic distribution of slow acetylator mutation in the polymorphic N-acetyltransferase (NAT-2) gene. Pharmacogenetics. 1994;4:125-34.
- [Google Scholar]
- Meta analysis of phenotype and genotype of NAT-2 deficiency in Chinese population. Pharmacogenetics. 1997;7:503-14.
- [Google Scholar]
- Polymorphic N-acetyltransferse (NAT-2) genotyping of Emiratis. Pharmacogenetics. 1997;7:73-82.
- [Google Scholar]
- Genetic polymorphism of NAT2 metabolizing enzymes on phenytoin pharmacokinetics in Indian epileptic patients developing toxicity. CNS Neurosci Ther. 2012;18:350-8.
- [Google Scholar]
- Arylamine N- acetyltransferase (NAT2) mutations and their allelic linkage in unrelated Caucasian individuals: Correlation with phenotypic activity. Am J Hum Genet. 1995;57:581-92.
- [Google Scholar]
- Genotype/phenotype discordance for human arylamine N-acetyltransferase (NAT2) reveals a new slow-acetylator allele common in African- Americans. Carcinogenesis. 1993;14:1689-92.
- [Google Scholar]
- Structure/function evaluations of single nucleotide polymorphisms in human N-Acetyltransferase 2. Curr Drug Metab. 2008;9:471-86.
- [Google Scholar]
- Joint Effects of the N-Acetyltransferase 1 and 2 (NAT1 and NAT2) genes and smoking on bladder carcinogenesis: A literature-based systematic huge review and evidence synthesis. Am J Epidemiol. 2007;166:741-51.
- [Google Scholar]
- N-acetyltransferase 2 genetic polymorphism: Effects of carcinogen and haplotype on urinary bladder cancer risk. Oncogene. 2006;25:1649-58.
- [Google Scholar]


