Translate this page into:
Cost & efficiency evaluation of a publicly financed & publicly delivered referral transport service model in three districts of Haryana State, India
Reprint requests: Dr Shankar Prinja, Assistant Professor of Health Economics, School of Public Health Postgraduate Institute of Medical Education & Research, Chandigarh 160 012, India e-mail: shankarprinja@gmail.com
-
Received: ,
This is an open-access article distributed under the terms of the Creative Commons Attribution-Noncommercial-Share Alike 3.0 Unported, which permits unrestricted use, distribution, and reproduction in any medium, provided the original work is properly cited.
This article was originally published by Medknow Publications & Media Pvt Ltd and was migrated to Scientific Scholar after the change of Publisher.
Abstract
Background & objectives:
Various models of referral transport services have been introduced in different States in India with an aim to reduce maternal and infant mortality. Most of the research on referral transport has focussed on coverage, quality and timeliness of the service with not much information on cost and efficiency. This study was undertaken to analyze the cost of a publicly financed and managed referral transport service model in three districts of Haryana State, and to assess its cost and technical efficiency.
Methods:
Data on all resources spent for delivering referral transport service, during 2010, were collected from three districts of Haryana State. Costs incurred at State level were apportioned using appropriate methods. Data Envelopment Analysis (DEA) technique was used to assess the technical efficiency of ambulances. To estimate the efficient scale of operation for ambulance service, the average cost was regressed on kilometres travelled for each ambulance station using a quadratic regression equation.
Results:
The cost of referral transport per year varied from ₹5.2 million in Narnaul to ₹9.8 million in Ambala. Salaries (36-50%) constituted the major cost. Referral transport was found to be operating at an average efficiency level of 76.8 per cent. Operating an ambulance with a patient load of 137 per month was found to reduce unit costs from an average ₹ 15.5 per km to ₹ 9.57 per km.
Interpretation & conclusions:
Our results showed that the publicly delivered referral transport services in Haryana were operating at an efficient level. Increasing the demand for referral transport services among the target population represents an opportunity for further improving the efficiency of the underutilized ambulances.
Keywords
Cost
efficiency
referral transport
scale of operation

India aims to reduce its child and maternal mortality rate by three quarters and two-thirds respectively, as part of the fourth and fifth Millennium Development Goals (MDGs). However, the goal seems distant as pace of decline of maternal and child mortalities remains low12. Almost 59 per cent of maternal deaths in India are due to obstetric complications3. It has been known that many obstetric emergencies such as haemorrhage and obstructed labour are unpredictable and can have catastrophic consequences within a short span of time4.
Lack of an institutional delivery to manage the obstetric complication during labour is associated with high maternal and neonatal mortality. These deaths are avoidable through timely referral to trained medical personnel5. Evidence from other low income countries, particularly in rural areas, also shows that considerable time is spent by women and their families in waiting for transportation and travelling to health facilities, which can be reduced by establishing an effective referral system6.
With a view to alleviate such delays, the Government of India and State governments have conceived a number of demand and supply side innovations related to the promotion of institutional delivery and the provision of transport. Among the supply side strategies, many State governments have introduced various referral transport services to address the issue of delays in receiving institutional care for delivery services. Some States have extended this service for antenatal, postnatal care, immunization and some other services7. Different models of implementation for referral services have been tried.
Though research has been done on effectiveness and quality of the referral transport services in India, no study has evaluated the ambulance service from an efficiency point of view7. With the two broad models of ambulance services operational in India, one which is publicly financed and delivered and another which is publicly financed and privately delivered, the question of efficiency remains a central consideration besides coverage and quality. Here we report the health system unit costs of operating the referral transport services in Haryana, India, a publicly financed and managed model. We also determined the technical efficiency of health system in provision of referral transport system and the most efficient scale of operation.
Material & Methods
The Government of Haryana introduced referral transport service branded as “Haryana Swasthya Vahan Sewa (HSVS) No.102” from November 2009. All the districts of Haryana are covered under the scheme. At present there is a total fleet of 335 ambulances in the State. The Scheme was initiated to address the problem of high maternal and infant mortality rates in the State by ensuring that pregnant women reach the healthcare institutions in time. Further, it seeks to reduce mortality rate following accidents and extends the services for regular check-ups of pregnant womens, postnatal care and immunization of the child.
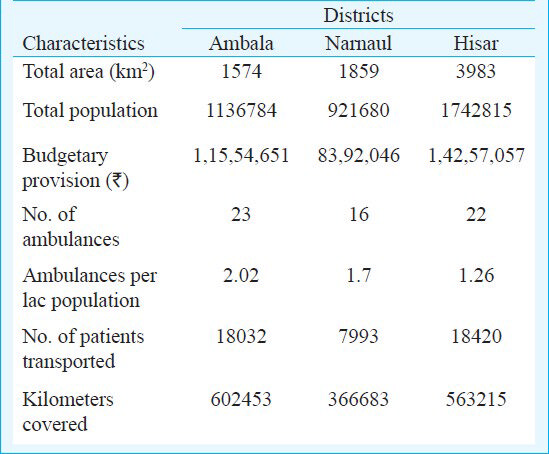
The cost analysis was done in the three districts of Haryana namely Ambala, Narnaul and Hisar (Table I). These districts represented high, medium and low utilization categories of districts in Haryana. In Ambala district, currently 23 ambulances are deployed which are serviced by 46 drivers. Hisar and Narnaul have a fleet of 22 and 16 ambulances, respectively which are manned by 45 and 28 drivers, respectively. A 24×7 control room is managed by call centre operators for receiving the calls and monitoring of ambulances through global positioning system (GPS) in all districts.
Study design: The economic cost of delivering ambulance services was estimated. This perspective was broader than the financial cost framework, because it included the opportunity cost of all resources consumed in production of a service, regardless of who paid for them.
Data collection: Cost data were collected for the three districts for a one year period in 2010. The analysis incorporated the costs incurred at both the district and the State level (Table II). The first step was to identify the various cost centres (call centre, ambulances, etc.) so as to allocate the costs associated with the delivery of referral transport services. Recurrent resources included staff salaries, consumables and other recurrent overhead inputs. Both full time and contractual personnel involved with referral transport were considered. Consumables included expenditure on stationery, petrol/diesel, etc. Overheads included monthly payments for electricity, internet, repair of vehicles and annual insurance payments. Capital resources constituted buildings which included the space costs for call centre supporting the provision of ambulance services; vehicles, call centre equipment, ambulance kit, etc. (Table II).
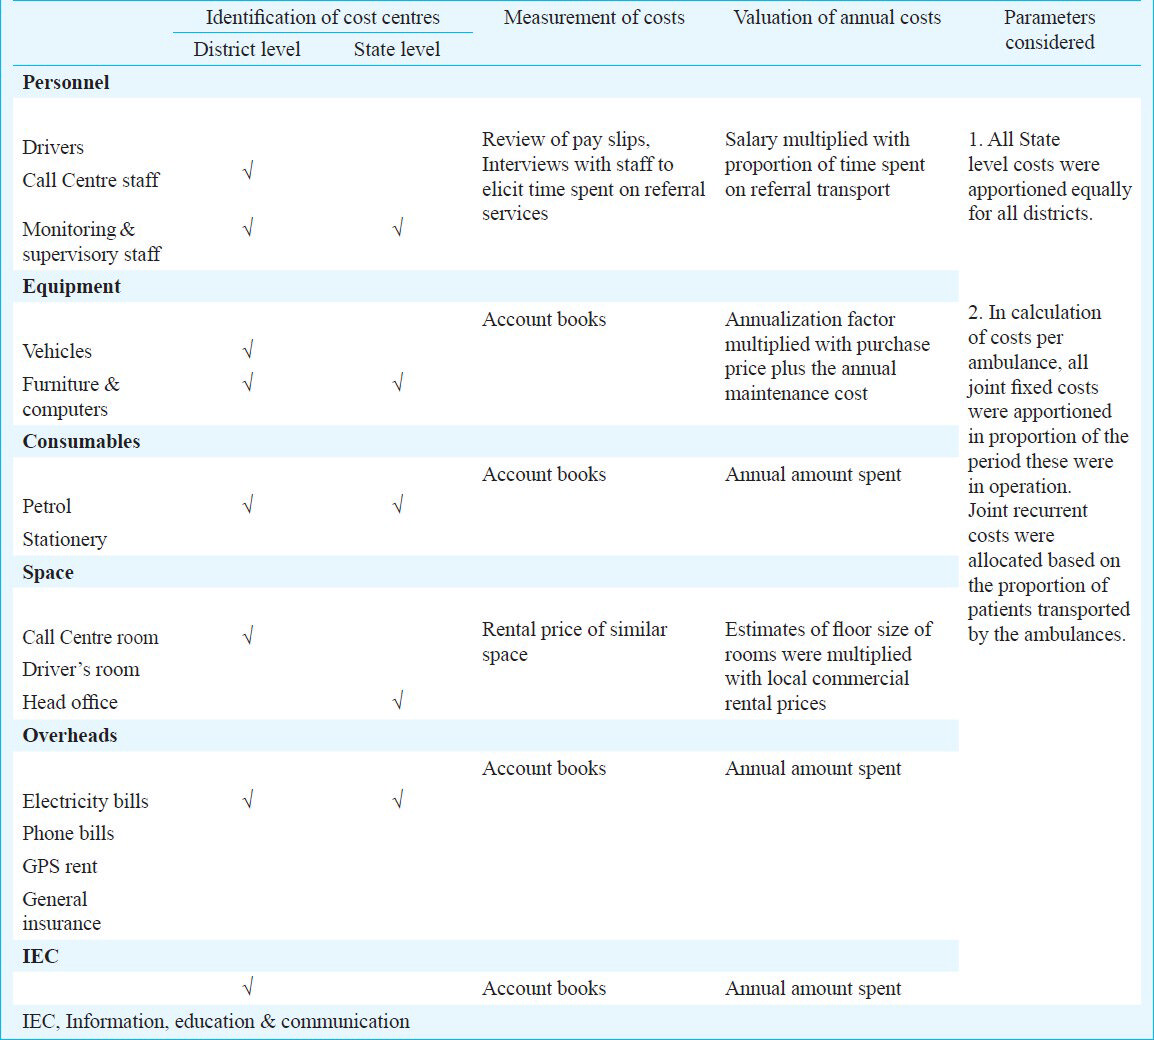
Besides these, resources spent at the State level for supervision and monitoring, information, education and communication (IEC) and the cost of administrative support were elicited. Resource and output data for two ambulances belonging to Hisar district were excluded from the analysis entirely, on account of these being discontinued during the year.
Data sources: Financial records for 2010 were assessed to collect the data for expenditure incurred on ambulances (both capital expense at the time of purchase and recurring such as repair and insurance) and consumables. For human resources, full-time equivalents were calculated for each staff member. Staff members involved in activities other than referral services were interviewed to elicit information on the time spent by them on each activity on a normal day. Gross salary was obtained from the pay slips of the staff which was inclusive of other allowances such as medical, pension, transport, rental benefits, etc. For space and infrastructure costs, estimates for the rental price of a similar space were obtained from a survey of real estate property dealers in the local area.
Most ambulances were donated, so the purchase price was not available. Thus, current market prices (current replacement cost) of similar vehicles were utilized. Vehicle logbooks were reviewed to obtain data on the kilometres (km) travelled, number of patients transported and petrol consumption. Similar procedure was followed for other equipment when prices were unavailable. Standard assumptions regarding the life of the equipment, discount rates (3%) were used89.
Data analysis: Capital expenditure was annualized, which involves spreading out the costs of capital goods over the useful life of the asset to arrive at the equivalent annual cost. Annualization takes into consideration the discount rate (time preference for money and inflation) and the lifespan of capital equipment. The space costs were calculated by multiplying the estimates of floor size of rooms devoted to referral services with local commercial rental prices of similar space. The costs incurred at the State level were apportioned equally for all districts. The average costs were estimated as ₹ per km and ₹ per patient transported. Unit costs were computed by dividing the total costs on capital equipment, space, personnel, consumables and overheads, with the number of patients transported annually (₹ per patient transported) in the first case and kilometers travelled annually by ambulances (₹ per km travelled) in the second scenario. Additionally, the costs of ambulances at each ambulance station point were ascertained. All joint recurrent costs were allocated based on the proportion of patients transported by the ambulances. To overcome the problem of missing data (extent of missing data being 6.5%) on diesel consumption, standard regression based imputation techniques were used to derive the relationship between kilometers covered and fuel consumption10. The relationship derived was then used to impute missing data.
Data Envelopment Analysis (DEA) was used to assess the technical efficiency. The technical efficiency scores were computed using data envelopment analysis programme, version 2.1 (DEAP 2.1) designed by Coelli11. The model was based on two inputs (cost incurred on vehicles and consumables) and an output (number of kilometers covered annually by the ambulance). The focus was on output oriented technical efficiency which seeks to answer how output quantities can be expanded without changing the input mix. A constant returns to scale assumption was made. DEA employs linear programming techniques to compute the efficiency scores for each ambulance. Ambulances that were technically efficient were assigned a score of 1 or 100 per cent, whereas inefficient ambulances were assigned efficiency scores of less than 1 (i.e. less than 100%).
To estimate the efficient scale of operation for ambulance service, the average cost on kilometers travelled for each ambulance station was regressed. Linear, logarithmic, exponential and quadratic regression models were tried, each of which was found to explain 53.2, 55, 63.5 and 74.3 per cent variability. Hence, finally the quadratic specification was used and the results were derived from quadratic regression. A quadratic regression equation as defined below was estimated using SPSS version 17.0 statistical software (SPSS Inc., USA).
AC = β0 + β1Q + β2Q2 + ε where: AC denotes average costs in ₹ per km, Q denotes kilometers covered by ambulances; ε represents all of the other factors that affect the level of average cost that cannot be measured and that are not explicitly included in the analysis.
We expect β1 to be negative, suggesting that as output rises, average costs fall. We expect β2 to be small and positive. Thus, at large levels of output (and therefore, at very large levels of output squared), average costs may start to level off or even increase, as the positive effect of β2Q2 offsets or dominates the negative effect of β1Q. It is the combination of β1 (whose negative slope indicates economies of scale), and β2 (whose positive slope indicates diseconomies of scale) that produces the characteristic parabolic, or U, shape of the average cost function.
To ascertain the optimal number of patients to be transported per month, linear regression was used to establish the relationship between the number of patients transported and kilometers travelled monthly.
Sensitivity analysis: A univariate sensitivity analysis was performed using SensIt version 1.45 software (San Francisco, USA), to ascertain the sensitivity of unit costs to changes in the underlying assumptions. Life of vehicles, discount rate, rental price, annual maintenance rate, life of other equipment such as computers, furniture, printer, phone sets, etc. were varied by 20 per cent on either side of the base value. Tornado diagram was used to graphically represent the results. Since the average life of ambulance had a single largest effect on unit cost, this assumption was varied from 5 to 12 yr (base assumption 8 yr).
Results
The service utilization was variable across the three districts studied. Hisar recorded the highest number of 70 patients transported per ambulance per month, while 65 and 42 patients were transported per ambulance per month in Ambala and Narnaul, respectively. In Narnaul district, an ambulance travelled nearly 46 km per patient transported while the distances travelled per referral in Ambala and Hisar were 33 and 31 km, respectively.
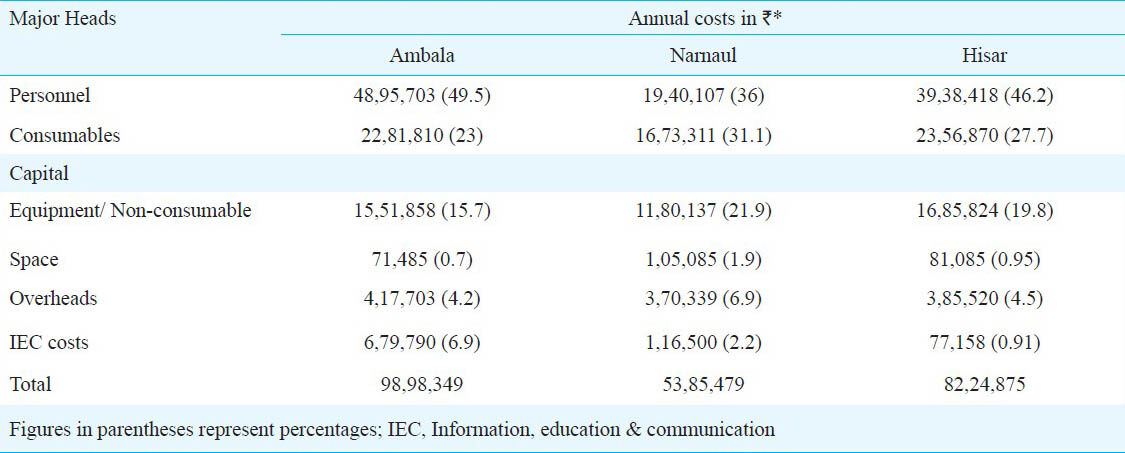
Cost of HSVS services: The annual costs were ₹ 9.9 million, 8.5 million and 5.4 million for Haryana Government to operate ambulance referral services in Ambala, Hisar and Narnaul, respectively with an average per district cost of ₹ 8.2 million. For Ambala district, personnel salaries formed the biggest constituent of total costs (49.5%) followed by consumables (23%) largely involving costs incurred on fuel; and equipment (15.7%) which mainly included annualized cost of ambulances (Table III). Similar order to contribution of different cost heads was observed for the other two districts.
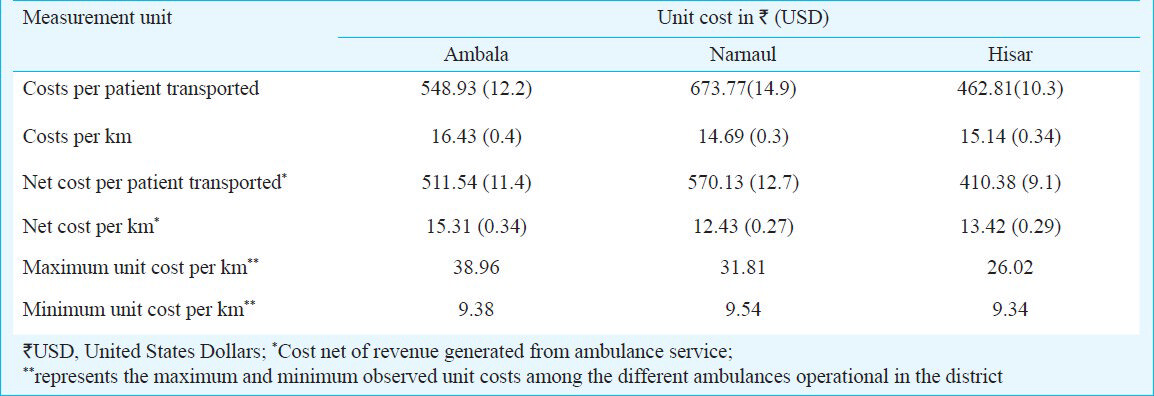
It was found that the health system spent on an average ₹ 674 per patient transported in Narnaul compared to ₹ 549 in Ambala and ₹ 463 in Hisar. The average cost per km to the Haryana Government for a district was ₹ 15.5. Unit cost per km transport was lowest for Narnaul (₹ 14.69), followed by Hisar (₹15.14) and Ambala (₹ 16.43) (Table IV). The revenues earned from Above Poverty Line (APL) patients as a per cent of total costs in Ambala, Hisar and Narnaul were 6.8, 11.32, 15.38 per cent, respectively. Average cost was relatively robust to all assumptions. Our results showed that it was most sensitive to changes in the useful life of the vehicles (2.1% variation on the higher side and 3.2% variation on the lower side of base value), followed by variations in discount rates (0.6% variation in average costs on either side of base value). Changes in the remaining assumptions had minimal impact on the average costs (Fig. 1). Average cost varied from ₹ 15.7 to 17.7 with the variation in assumption for average life of vehicle from 5 to 12 yr respectively.

- Sensitivity of estimated unit costs to underlying assumptions. AMC, annual maintenance cost.
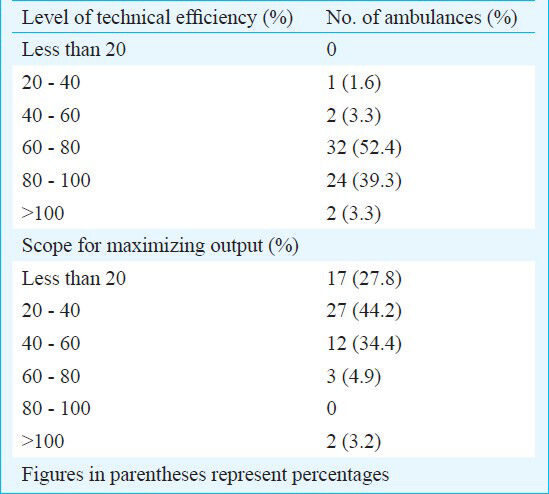
Technical efficiency of HSVS services: The average technical efficiency of the HSVS model of referral transport services was found to be 76.8 per cent. About 91 per cent ambulances operated at an efficiency level of more than 60 per cent, while 39 per cent operated at a level of more than 80 per cent efficiency (Table V). In about 44 per cent ambulances, there was a scope for increasing output i.e. patients transported by about 20-40 per cent (Table V). Further, there was a scope for increasing the output by about 40-60 per cent in about 34 per cent ambulances.
The regression model explained over 74 per cent of the variance in average costs (Fig. 2). In addition, the coefficients were statistically significant (P<0.001). The most efficient scale of operation for an ambulance as determined by minimizing the estimated average cost function was 51451 kilometres annually. It was found that an ambulance would serve most efficiently if it caters to 137 patients in a month. Attainment of this level would enable unit cost to reduce to ₹ 9.57 per km, which is currently about ₹ 15.5 per km.
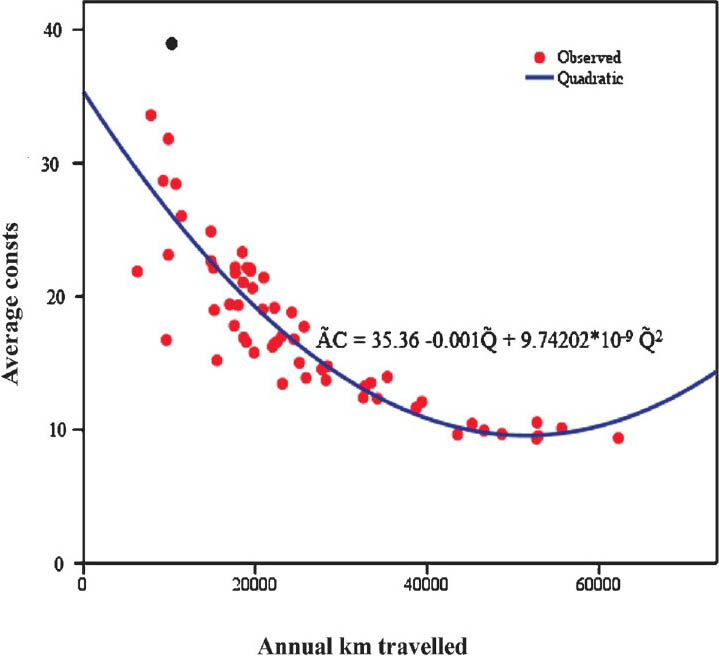
- Average cost (₹ per km) curve for referral transport service in Haryana, 2010.
Discussion
In the present study the unit costs of operating referral transport services were estimated in Haryana State from a health system. It was found that the ambulance services costed the Government on average ₹ 15.5 per km travelled in 2010. Our results indicated that the major proportion of total costs comprised the salaries paid to the staff (35-49%; varying across districts). The overall level of efficiency for operating the HSVS model in Haryana was 76 per cent. Under optimal scenario, it was found that the most efficient level for operating an ambulance was with a patient load of 137 per month.
There are a few studies that have focussed on evaluation of health system costs of publicly provided services in India121314. Most studies have concentrated on out-of-pocket expenses incurred by individuals while availing health services1516. Within the domain of referral transport services, there is one report showing estimates of health system costs of providing ambulance services17. It estimated the expenditure per call for operating Centralised Accident & Trauma Services (CATS) in the range of ₹ 1554 (USD 34.5) to ₹ 1768 (USD 39.3) in 1996 to 1998. But the results are not comparable to our study owing to difference in the methodology adopted. We have taken a more comprehensive approach of costing from an economic perspective, compared to financial perspective in costing of CATS. Moreover, the CATS service was a more specialized service with high cost ambulances with life support equipment and accompanied by trained paramedics.
There was a few limitations in the present study. Firstly, there was a problem of missing data during data collection. But the percentage of missing data was quite small to have had a significant impact on the validity of results. Purchase price was unavailable for some vehicles and equipment which would have otherwise been used with GDP deflators to arrive at current costs. However, to tackle this, current market prices were used18. Even though a few assumptions were made regarding the life of capital equipment and discount rate but as the sensitivity results pointed out, the assumptions did not affect the robustness of the results. The timeliness of ambulance services was not included in the regression model. But findings from overall evaluation of referral services in Haryana suggest that 82.3 per cent of patients were transported to a health facility within an hour19. So, if one hour is taken as the minimum threshold then, timeliness does not seem to have had much impact on our results. However, this remains a limitation of the present study.
It has been previously found that there is a significant scope for improving the efficiency of publicly provided and financed health services2021. Not many assessments of the health system in India have been done from an efficiency point of view. Of those which have been done, most conclude a significant scope for improving efficiency2223. These efficiency arguments are also strongly voiced while advocating for greater role of private sector in delivery of health care. With private sector being a major contender for delivery of referral transport services, our study results hold significance. Contrary to some of the previous evaluations of health system, we found that the health system provided a fairly efficient model of referral transport services in Haryana.
There is still a scope for increasing the efficiency by increasing the outputs. About 46.7 per cent of patients who were admitted in public hospitals and who reached the hospital through their own means were unaware of the government run ambulance service19. This view is supported by an assessment of the referral transport scheme for emergency obstetric care under RCH I conducted in Rajasthan, which concluded the lack of information among non-users as the single most important factor distinguishing them from users of the service24. IEC costs constituted a minor proportion (0.91-6.9%) of total costs in the three districts. It may be considered to increase the spending to increase awareness about the service to enhance utilization rates. A second option is to make the services free for all, rather than charging those above poverty line individuals. Cost recovery through user charges is less than 10-15 per cent in all districts. Since the service has already picked up among the poor and rural dwellers, the service is less likely to have adverse outcomes on equity front once it is made free for all.
Overall evaluation of HSVS service in Haryana showed found that the utilization of health services was low in Primary Health Centres (PHCs) and Community Health Centres (CHCs). Majority users (25-40%) under the study, availed services at the district hospitals. Moreover, service utilization was concentrated (45% of the users) during the day time. District Level Household Survey (2007-08) results also point in the same direction25 which found that only 38.3 per cent of the PHCs in Haryana were functioning round the clock.
In conclusion, our study provides evidence for the need to enhance efficiency of referral transport service in Haryana. From a pure fiscal perspective, the cost of running the ambulance service at district level constitutes less than 2 per cent of an average district health budget in Haryana26. Hence the investment on referral transport does not impose much fiscal pressure. To make the referral transport services more efficient, one option is to station ambulances at points which have adequate demand. However, this may have a downside in terms of increasing travel time of ambulance and thus lower the quality of services by reducing accessibility to services. More feasible option is to enhance demand through IEC. Another strategy which could be used to generate demand is to make the referral transport service free for entire population.
Acknowledgment
Authors acknowledge financial support received from National Health Systems Resource Centre (NHSRC), New Delhi, India. Dr Rakesh Gupta IAS, Mission Director (NRHM), Haryana, Dr T. Sundararaman, Executive Director, NHSRC, New Delhi and Dr Amit Phogat, Nodal Officer, HSVS, NRHM, Haryana provided valuable guidance and support during study design and data collection.
References
- Govt. of India. Millennium Development Goals: India Country Report 2009 India: Ministry of Statistics and Programme Implementation. 2009. Available from: panipolis.iiep.unesco.org/upload/India/India_MDG_report_2009.pdf
- [Google Scholar]
- Progress towards Millennium Development Goals 4 and 5 on maternal and child mortality: an updated systematic analysis. Lancet. 2011;378:1139-65.
- [Google Scholar]
- Registrar General of India. Maternal mortality in India: 1997-2003: trends, causes and risk factors. New Delhi: Office of the Registrar General of India; 2006.
- [Google Scholar]
- Antepartum and postpartum haemorrhage. In: Murray CJ, Lopez AD, eds. Health dimensions of sex and reproduction. Boston, MA: Harvard University Press; 1998. p. :172-4.
- [Google Scholar]
- Reducing child mortality in India in the New Millennium. Bull World Health Organ. 2000;78:1192-9.
- [Google Scholar]
- Maternal and child mortality development goals: What can the transport sector do? Washington, DC: The World Bank; 2006.
- [Google Scholar]
- Govt. of India. Directory of innovations implemented in the health sector. New Delhi: Ministry of Health and Family Welfare and Department for International Development (DFID); 2008.
- [Google Scholar]
- Multi-country evaluation of the integrated management of childhood illnesses (IMCI) In: Analysis report of the costs of IMCI in Tanzania. Geneva: Department of Child and Adolescent Health and Development, World Health Organization; 2004.
- [Google Scholar]
- Making choices in health: WHO guide to cost-effectiveness analysis. Geneva: World Health Organization; 2003.
- [Google Scholar]
- Missing ….presumed at random: cost-analysis of incomplete data. Health Economics. 2002;12:377-92.
- [Google Scholar]
- A guide to DEAP Version 2.1: A data envelopment analysis (Computer) Programme. University of New England, Department of Econometrics. CEPA Working Paper 8/96; 1996.
- [Google Scholar]
- A comparative study to analyze the cost of curative care at Primary Health Center in Ahmedabad. Indian J Community Med. 2010;35:153-8.
- [Google Scholar]
- Cost of delivering child health care through community level health workers: How much extra does IMNCI programme cost? J Trop Pediatr. 2013;59:489-95.
- [Google Scholar]
- Cost of neonatal intensive care in a tertiary care center. Indian Pediatr. 2005;42:989-97.
- [Google Scholar]
- Care-seeking behavior and out-of-pocket expenditure for sick newborns among urban poor in Lucknow, northern India: a prospective follow up study. BMC Health Serv Res. 2009;9:61.
- [Google Scholar]
- The economic implications of non-communicable diseases for India, Health, Nutrition and Population (HNP) Discussion Paper. Washington, DC: World Bank; 2009.
- [Google Scholar]
- Govt. of Delhi. Report of evaluation study on centralised accident & trauma services (CATS) Delhi: Evaluation Unit, Planning Department, Government of Delhi; 2001.
- [Google Scholar]
- Cost Analysis in Primary Health Care. In: A training manual for program managers. Geneva: World Health Organization; 1994.
- [Google Scholar]
- Evaluation of Haryana emergency ambulance services. Chandigarh: School of Public Health, PGI & National Health System Resource Centre; 2011.
- [Google Scholar]
- Planning Commission. Report of the Working Group on Health Care Financing including Health Insurance for the 11th Five Year Plan. New Delhi, India: Ministry of Health & Family Welfare; 2006.
- [Google Scholar]
- Govt. of India. Report of the National Commission on Macroeconomics and Health. New Delhi: Ministry of Health and Family Welfare. Government of India; 2005.
- [Google Scholar]
- Efficiency of health care sector at sub-state level in India: A case of Punjab. Online J Health Allied Sci. 2009;8:1-6.
- [Google Scholar]
- Health system performance in rural India: Efficiency estimates across States. Economic Political Weekly. 2004;27:1427-33.
- [Google Scholar]
- IIHMR. Assessment of referral transport scheme for emergency obstetric care. Under RCH Phase I Rajasthan. Jaipur: Indian Institute of Health Management Research; 2004.
- [Google Scholar]
- International Institute for Population Sciences (IIPS). District level household and facility survey (DLHS-3), 2007-08: India. Haryana, Mumbai: IIPS; 2010.
- [Google Scholar]
- Government of Haryana. Program Implementation Plan - 2011-12. National Rural Health Mission. Panchkula: Government of Haryana; 2011.
- [Google Scholar]


