Translate this page into:
A rapid & sensitive liquid chromatography- tandem mass spectrometry method for the quantitation of busulfan levels in plasma & application for routine therapeutic monitoring in haematopoietic stem cell transplantation
Present address: *PSG Center for Molecular Medicine & Therapeutics, PSG Institute of Medical Sciences & Research, Coimbatore, India
**Tata Medical Center, Kolkata, India
Reprint requests: Dr Poonkuzhali Balasubramanian, Professor, Department of Haematology, Christian Medical College, Vellore 632 004, India e-mail: bpoonkuzhali@cmcvellore.ac.in
-
Received: ,
This is an open-access article distributed under the terms of the Creative Commons Attribution-Noncommercial-Share Alike 3.0 Unported, which permits unrestricted use, distribution, and reproduction in any medium, provided the original work is properly cited.
This article was originally published by Medknow Publications & Media Pvt Ltd and was migrated to Scientific Scholar after the change of Publisher.
Abstract
Background & objectives:
Busulfan (Bu) in combination with cyclophosphamide is widely used in myeloablative conditioning regimen prior to haematopoietic stem cell transplantation (HSCT). Its narrow therapeutic range and toxic side effects at high systemic exposure and graft rejection at low exposure emphasize the need for busulfan dose optimization using targeted dose adjustment prior to HSCT. We report here a rapid and sensitive method to quantitate busulfan plasma levels in patients receiving busulfan as part of pre-transplant conditioning.
Methods:
The method involves simple protein precipitation of the plasma followed by analysis using a high performance liquid chromatography (HPLC) with tandem mass spectrometry - electrospray ionization technique (LC-ESI MS/MS) in positive ionization mode and quantified using multiple reaction monitoring (MRM). Deuterated busulfan (d8-busulf`an) was used as the internal standard.
Results:
The method was linear for the concentration ranging from 0 to 4000 ng/ml of busulfan with a limit of detection of 2 ng/ml and limit of quantitation of 5 ng/ml. The assay was accurate for serial concentrations of Bu in plasma for five consecutive days and the CV was less than 10 per cent.
Conclusion:
Using this rapid and sensitive method, busulfan levels were targeted and subsequent doses adjusted at our center in 26 patients receiving high dose busulfan in combination with cyclophosphamide or fludarabine.
Keywords
Busulfan
HSCT
mass spectrometry
therapeutic monitoring

Busulfan is a bifunctional alkylating agent, commonly used in combination with cyclophosphamide as a conditioning regimen for patients with malignant and non-malignant diseases undergoing haematopoietic stem cell transplantation (HSCT)123. Wide inter-patient variation in the pharmacokinetics of busulfan resulting in variation in treatment outcome and a narrow therapeutic range make the dosing strategies of busulfan complex456. Higher systemic exposure to busulfan has been shown to be associated with hepatic sinusoidal obstruction syndrome, neurotoxicity or interstitial pneumonia, while low levels are associated with increased incidence of graft rejection78910. Targeted dose adjustments of busulfan have been shown to reduce the incidence of toxicities and rejection and to improve transplant outcome7891011.
Several methods have been developed for the determination of busulfan in plasma, including gas chromatography-mass spectrometry (GC-MS), gas chromatography with electron capture detection (GC-ECD), and high performance liquid chromatography with ultraviolet detection (HPLC-UV)121314151617. We initially developed a GC-MS method16, based on the determination of derivatized busulfan (di-TFTP-butane) using tetrafluorothiophenol (TFTP) to determine busulfan concentrations in plasma. Subsequently the same derivatization was applied to develop an HPLC method with UV detection18. This method is time consuming due to the long derivatization and extraction steps involved and hence was not suitable for routine therapeutic monitoring of busulfan. Recent studies have described simpler and rapid HPLC-MS/MS method for busulfan analysis in plasma19202122. Here we describe a new HPLC- tandem mass spectrometry method for the analysis of busulfan levels in plasma. LC-ESI MS/MS (liquid chromatography and tandem mass spectrometry with electron spray ionisation) technique was used in positive ionization mode with deuterated internal standard (d8-busulfan) and was quantified using multiple reaction monitoring (MRM) method. We used the same sample processing method described by Quernin et al19. Using this new LC-MS/MS based method, we attempted to do targeted dose adjustment of busulfan levels in patients undergoing HSCT prepared with a busulfan/cyclophosphamide or fludarabine/busulfan based conditioning regimen.
Material & Methods
The internal standard d8-busulfan was custom made from ERDI- (Eno research chemicals and Custom synthesis, Research Triangle Park, NC, USA). Busulfan standard as well as mass spectrometry grade acetone, acetonitrile, ethyl acetate, ammonium acetate were purchased from Sigma-Aldrich (Sigma-Aldrich Corporation Bangalore, India). Milli-Q water was obtained from Millipore water purification system.
Calibration standards and controls: Stock solution of busulfan at 500 μg/ml in acetone was made fresh during each assay. The d8-busulfan internal standard at 5 μg/ml were made in acetone and stored as single use aliquots at -80°C. Calibration curves for standard busulfan were prepared by spiking blank plasma with serial dilutions of stock busulfan to get concentration ranging from 0, 50, 100, 200, 500, 1000, 2000, 2500, 3000, 4000 ng/ml. Quality control plasma samples were prepared daily by spiking drug-free normal plasma with 2 different concentrations of 2000 and 4000 ng/ml. The working solution for internal standard d8-busulfan was made fresh each time from the stock solution.
Sample processing: Simple protein precipitation protocol as described previously by Quernin et al18 was used. Briefly, to 250μl of plasma, 25μl of internal standard (d8-busulfan) was added and vortexed for 30 sec. Then 300 μl of Milli-Q water was added along with 2 ml of ethyl acetate and mixed exactly for 30 sec using a vortex mixer for protein precipitation. The tubes were centrifuged at 1316 g for 10 min at 4°C. The clear supernatant containing busulfan and d8-busulfan were then dried under nitrogen gas at 65°C. The residue present in the dried tubes is reconstituted with 400 μl of mobile phase. The supernatant was then filtered using pre-filter spin column (ThermoFisher, Chennai, India) and the filtrate was transferred to an auto sampler vial. Ten μl of each sample was injected into the LC-MS/MS system. Busulfan levels were expressed as ng/ml.
HPLC and mass spectrometry conditions: A Shimadzu liquid chromatographic system (UFLC) (Shimadzu, Kyoto, Japan), comprising LC-20ADvp binary pump, CTO-20A column oven and a refrigerated auto sampler SIL-HTC was used. HPLC separation were performed using Gemini C6 phenyl column (50 × 2.0 mm, 5.0 μm particle size, 110A0; Phenomenex, USA) at a run time of 5.0 min with a C18 guard column (ODS, 4 mm L*3.0 mm ID, Phenomenex, USA) and column oven temperature of 35°C. The mobile phase consisted of 10 mM Ammonium acetate pH 6.69 and acetonitrile (40: 60 v: v) used in a binary gradient mode at a flow rate of 0.250 ml/min.
Mass spectra were obtained using an Applied Biosystems SCIEX API2000 mass spectrometer (Sciex Division of MDS, Toronto, Ontario, Canada) equipped with a TurboIonSpray (ESI) interface in the positive ion mode and MRM method to quantitate the data.
Ion suppression or matrix effect: The presence of matrix components in biological fluids like blood plasma can cause suppression (under-estimation) or enhancement (over-estimation) of the target analyte response. Two different samples were processed; one containing analyte in the drug-free normal plasma and the analyte without plasma. The samples were processed similar to the patient's samples. The MRM responses of both the samples were quantitated. A low analyte signal in the matrix compared to the signal in the analyte without plasma indicates the presence of interfering agents causing ion suppression.
Method development: This method was developed to quantify busulfan in small volumes of plasma. The ionization efficiency and the peak intensity were high in positive ionization mode, in accordance to the published literature1920. The fragmented daughter ion produced was scanned in MRM mode, detected by Channel Electron Multiplier (CEM) to obtain a spectrum based on the Mass/Charge (m/z) ratio. A full scan mass spectrum was performed for busulfan with d8-busulfan containing 246 and 254 amu. The expected ions with a maximum intensity and a dwelling time of 400 milliseconds were observed at m/z 264.1/151.0 for busulfan and 272.1/159.1 for d8-busulfan, (because of ammonium adduct formation) corresponding to the deprotonated molecular species.
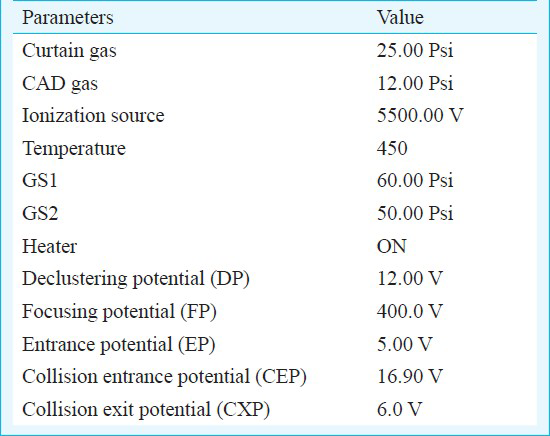
The MS parameters optimized both for the analytes as well as for the internal standards (d8-busulfan) were as shown in Table I. The analyte and internal standard area was quantitated using the Analyst 1.4.2 software (Applied Biosystems, MDS-Sciex, Canada). Nitrogen gas was used for nebulization and for desolvation.
Method validation: Quantification was performed by taking the ratio of Bu/d8-Bu (Standard/Internal standard) and by plotting the peak area ratio against known concentration of spiked plasma standards. The inter-day accuracy and precision were evaluated by extraction and analysis for serial concentrations of Bu in plasma for 5 consecutive days. The linearity was determined by analyzing plasma standards prepared to contain 0 - 2500 ng/ml of Bu, and the mean correlation coefficient for each regression equation was generated on five different days. The intra-day accuracy of the assay was tested by extraction and analysis from lower to higher concentration in five different batches of Bu in plasma prepared on the same day. The limit of detection and quantification was also analyzed.
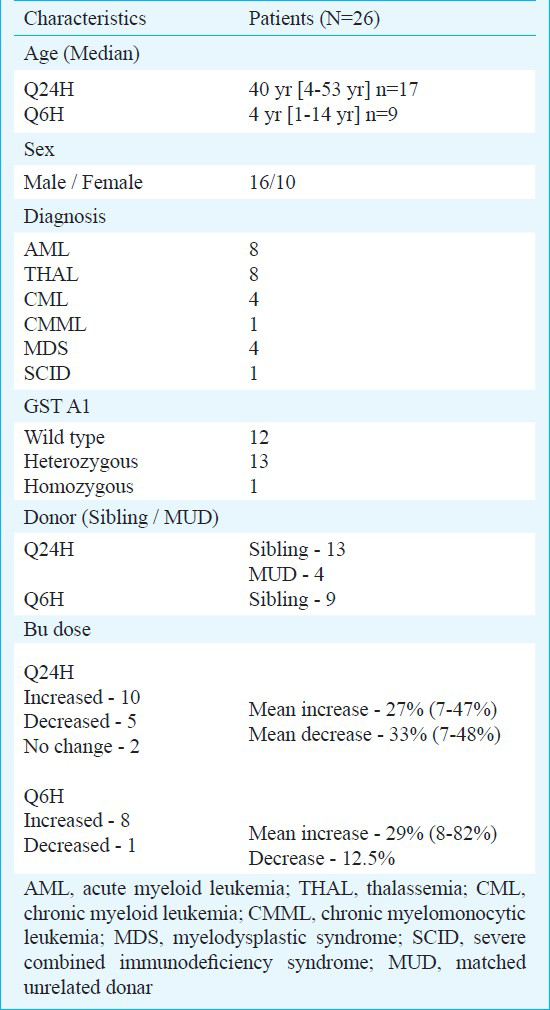
Therapeutic monitoring of busulfan: This prospective study was carried out at in the Department of Haematology, Christian Medical College & Hospital, Vellore, Tamil Nadu. Twenty six consecutive patients receiving high dose i.v busulfan in combination with cyclophosphamide or fludarabine as conditioning regimen prior to HSCT between June 2010 and March 2011 were included. Written consent was obtained from all the patients and the study protocol was approved by the Institutional Review Board. Patients’ details are given in Table II.
Patients received i.v busulfan as a 2 or 3 h infusion depending on the dosing schedule. Peripheral blood samples (3-5 ml) were taken from central venous catheter and collected in heparinized tubes. Two different sample collection protocols were used: in patients receiving busulfan/cyclophosphamide based regimen, busulfan was given Q6h over a 2 h infusion and those receiving fludarabine/busulfan based regimen, busulfan was given after fludarabine as Q24h over a 3 h infusion. Blood samples were collected immediately before the start and at the end of infusion, as well as 1, 2 and 4 h after the end of infusion. In both cases, the samples were immediately refrigerated and centrifuged at 1895 g for 3 min at 4°C within 1.5-2 h of collection, and the plasma was used for analysis. If subsequent busulfan dose was adjusted, plasma samples were collected again on the 3rd day (3rd or 9th dose in Q24h or Q6h regimens, respectively) and levels measured to check if the targeted levels are achieved.
The calculation of busulfan AUC was done using limited sampling scheme following the published report23. The plasma busulfan levels measured for each patient are plotted against time of sampling and area under curve (AUC) was calculated using linear trapezoidal rule. The computed ln concentration at the end of the dosing interval (6 or 24 h) and the elimination rate constant (Kel) was used to calculate the extrapolated AUC. This is then added to the calculated AUC to get the AUC 0-infinity. AUC of 5500-6000 μmoles or 900-1350 μmoles were targeted for patients receiving Q24h or Q6h, respectively and subsequent doses were adjusted to achieve these values.
Results & Discussion
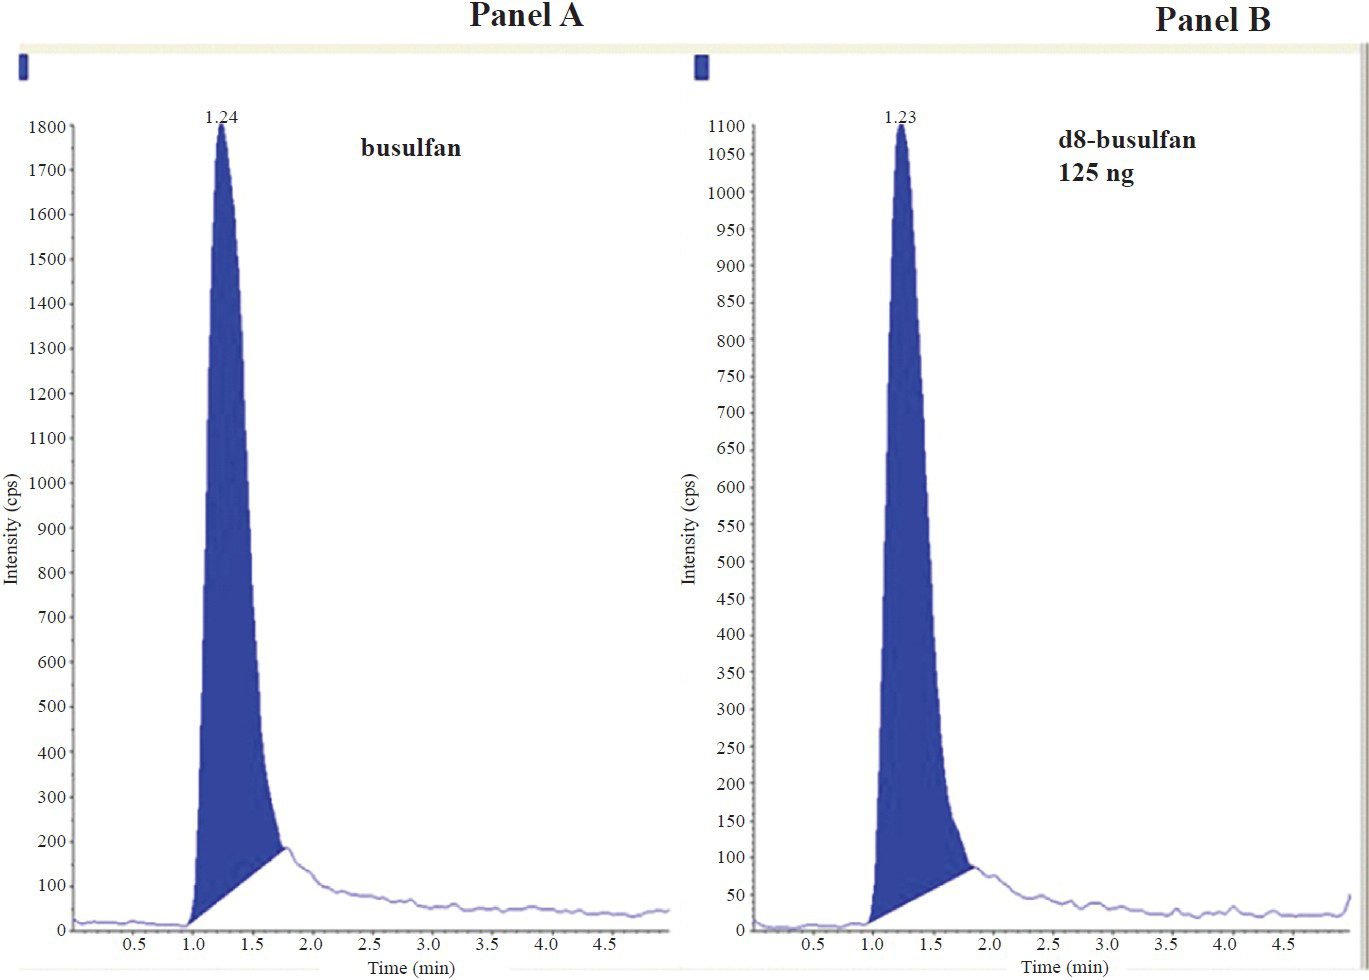
Chromatographic separation: The mass spectrum of blank plasma did not show any interference peak that would affect the analytes. The retention times for Bu (m/z 264.1 /151 amu) and internal standard (m/z 272.1/159.1 amu) were respectively 1.24 and 1.23 min. Minimal matrix interference was observed but it did not affect both the analytes and the internal standard. Fig. 1 shows chromatogram of blank plasma and plasma spiked with 125 ng of d8 busulfan. Fig. 2 represents the chromatogram obtained from drug free plasma spiked with 1000 ng of busulfan and 125 ng of d8-busulfan. Fig. 3 shows chromatogram obtained from a patient's plasma sample collected 120 min after the end of infusion of busulfan spiked with internal standard.
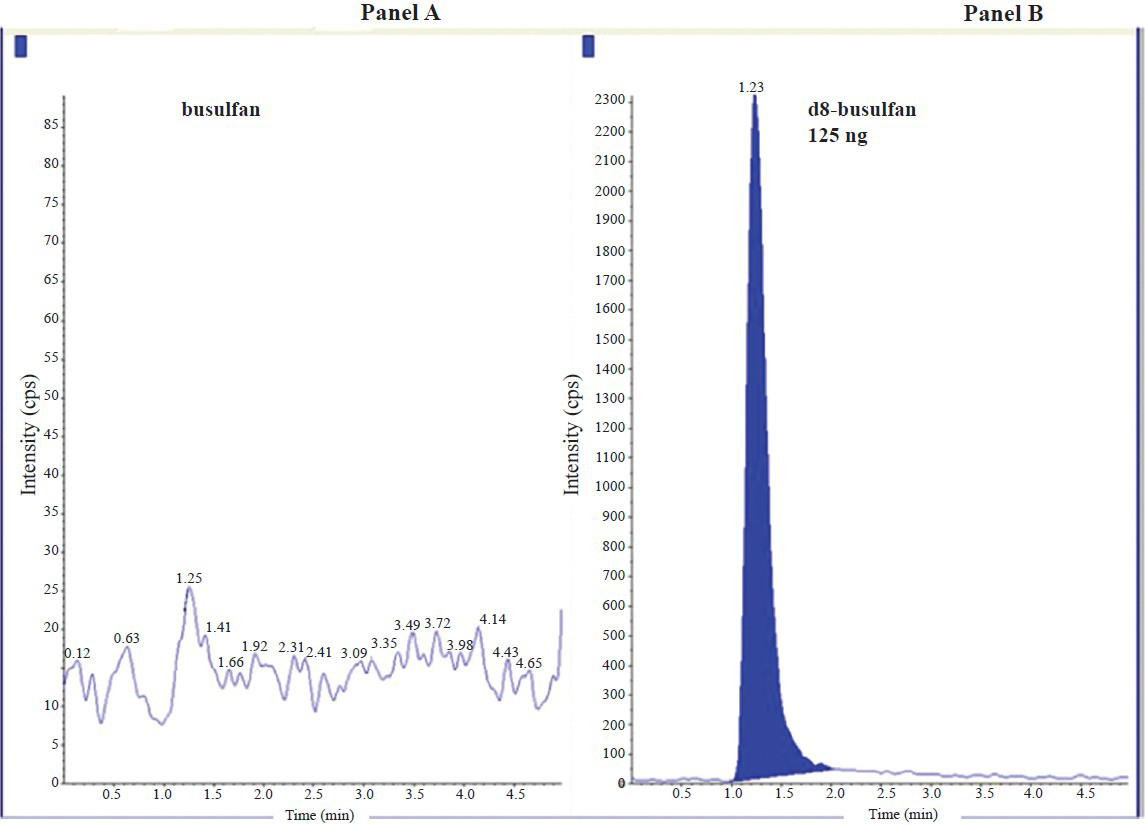
- Representative chromatograms obtained from drug free plasma without busulfan and plasma spiked with 125ng of d8 busulfan. Panel A: Chromatogram of drug-free plasma for busulfan showing no detectable busulfan; Panel B: Chromatogram showing d8-busulfan. Retention time of Busulfan: 1.24 min and d8-busulfan: 1.23 min.
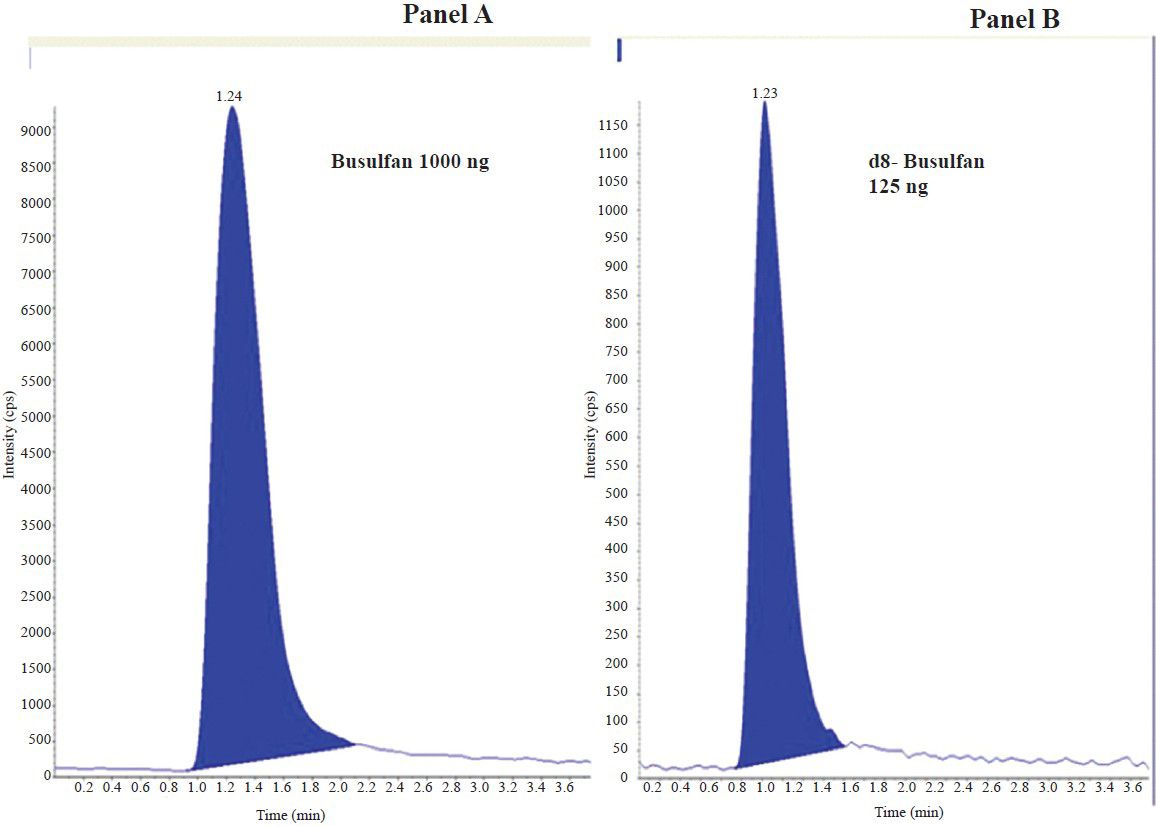
- Representative chromatograms obtained from drug free plasma spiked with 1000 ng of busulfan and 125 ng of d8-busulfan. Panel A: Chromatogram showing busulfan; Panel B: Chromatogram showing d8-busulfan.
- Representative chromatogram obtained from a patient's plasma at 120 min after the end of busulfan infusion. Panel A: Chromatogram of busulfan obtained from patient's plasma after 120 min of busulfan infusion; Panel B: Chromatogram showing d8-busulfan by spiking patient's plasma with 125ng internal standard.
Quantitative analysis: Quantification was done by plotting the peak area ratio of Bu/d8 Bu against known concentration of spiked plasma standards. The recovery from extraction was 95 and 100 per cent. The sensitivity of the assay at a signal to noise ratio of 5 was 10 ng/ml.
Accuracy and precision: The assay was accurate for serial concentrations of Bu in plasma for five consecutive days and the coefficient of variation (CV) was less than 10 per cent. The linearity was determined by analyzing plasma standards prepared to contain 0-2500 ng/ml of Bu, and the mean correlation coefficient for each regression equation was generated on five different days. The assay was linear for concentrations 0-2500 ng/ml. The intra-day accuracy and precision of the assay were tested by extraction and analysis from lower to higher concentration in five different batches of Bu in plasma prepared on the same day (Table III).
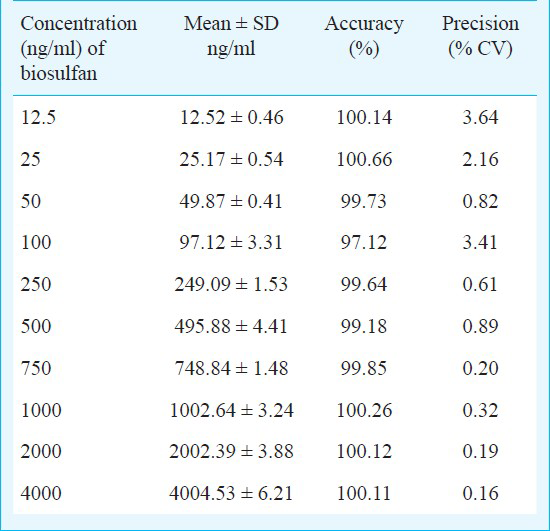
Limit of detection and quantitation: This method was linear for the concentration ranging from 5 to 2500 ng/ml (r = 0.9981) of busulfan with a limit of detection of 2 ng/ml and limit of quantitation of 5 ng/ml. The inter-day and intra-day variabilities were less than 10 per cent.
Application of this method for targeted dose adjustment of busulfan: Using this method, targeted dose adjustment of busulfan was done in 26 patients undergoing HSCT for various conditions. The median AUC of busulfan after the first dose in patients receiving Q24h dose was 3645 (1713-10457 μmoles) and after dose adjustment, the third dose AUC was 5496 (range 4909-7702 μmoles). The median AUC of busulfan after the first dose in patients receiving Q6h dose was 505 (307-875 μmoles) and after dose adjustment, the ninth dose AUC was 772 (range 593-1299 μmoles). Fig. 4 shows log plots of concentration vs. time curves for both the single daily and four times daily doses. Of the 26 patients, the 2nd or 5th busulfan dose was increased in 19 patients (range: 7-83% increase). In two patients there was no dose adjustment required while the remaining five patients needed dose reduction (6-37%). All the patients achieved targeted levels after dose adjustment except one patient in whom the dose had to be further adjusted. With the current method we could adjust 3rd dose of busulfan in Q6h regimen and 2nd dose of busulfan in Q24h regimen. Therapeutic drug monitoring of busulfan is necessary because of pharmacodynamic relationships between systemic exposure of Bu with outcome such as liver toxicity and efficacy in patients receiving Bu/Cy conditioning regimen for a HSCT. It is clear from these preliminary data that majority of our patients were achieving lower than required busulfan AUC and would have continued to do so, if their busulfan doses were not adjusted to achieve this targeted levels.
In conclusion, a rapid, sensitive and reproducible method was developed to determine the busulfan levels in human plasma. Targeted dose adjustment of busulfan was done in patients undergoing HSCT. Evaluation of transplant outcome parameters like graft rejection, transplant related mortality, overall survival, and event-free survival in these patients as well as comparison of these parameters with a retrospective cohort of patients without busulfan dose adjustment will be done. This method is routinely being used for measuring busulfan levels in patients undergoing HSCT and individualizing the dose in an attempt to reduce toxicity and/or graft rejection/relapse.
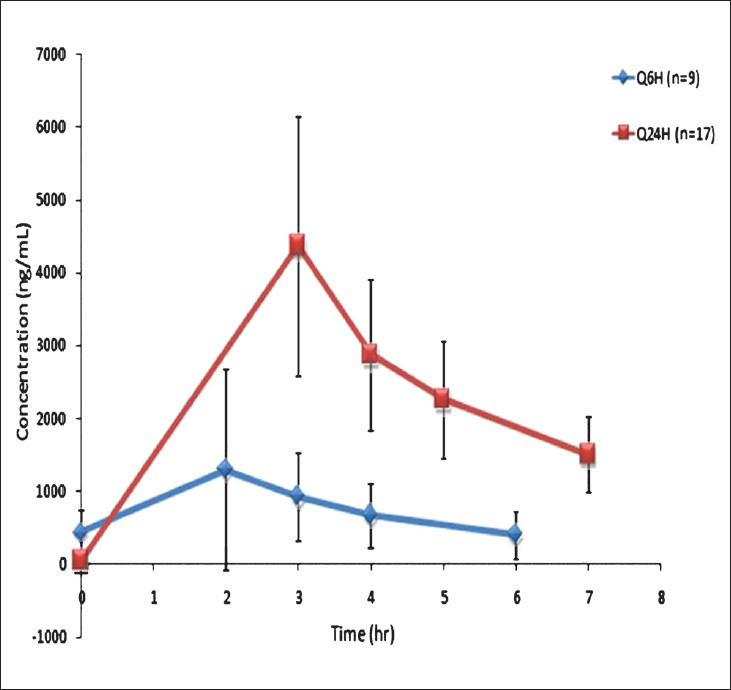
- Log plots of concentration vs. time curves for both the single daily, Q24H (n=17) and four times daily, Q6H (n=9) doses.
Acknowledgment
This study is supported by Department of Biotechnology, New Delhi, India (Grant no: BT/PR7596/MED/12/291/2006).
References
- Busulfan (Bu) and cyclophosphamide (Cy) for marrow transplantation. Bone Marrow Transplant. 1989;4(Suppl 1):236-9.
- [Google Scholar]
- The development of busulfan/cyclophosphamide preparative regimens. Semin Oncol. 1993;20:12.
- [Google Scholar]
- Busulfan and cyclophosphamide versus cyclophosphamide and total body irradiation for marrow transplantation in chronic myelogenous leukemia - a review. Leuk Lymphoma. 1993;11(Suppl 1):201-4.
- [Google Scholar]
- Pharmacokinetics of high-dose busulfan in children. Cancer Chemother Pharmacol. 1989;24:386-90.
- [Google Scholar]
- Pharmacokinetics of oral busulphan in children with beta thalassaemia major undergoing allogeneic bone marrow transplantation. Bone Marrow Transplant. 1999;24:5-11.
- [Google Scholar]
- Busulfan disposition: the role of therapeutic monitoring in bone marrow transplantation induction regimens. Semin Oncol. 1993;20:18-25. quiz 26
- [Google Scholar]
- Pharmacokinetics of busulfan: correlation with veno-occlusive disease in patients undergoing bone marrow transplantation. Cancer Chemother Pharmacol. 1989;25:55-61.
- [Google Scholar]
- High busulfan concentrations are associated with increased transplant-related mortality in allogeneic bone marrow transplant patients. Bone Marrow Transplant. 1997;20:909-13.
- [Google Scholar]
- Graft-rejection and toxicity following bone marrow transplantation in relation to busulfan pharmacokinetics. Bone Marrow Transplant. 1995;16:31-42.
- [Google Scholar]
- Busulfan disposition and hepatic veno-occlusive disease in children undergoing bone marrow transplantation. Cancer Chemother Pharmacol. 1996;37:247-53.
- [Google Scholar]
- Target dose adjustment of busulfan in pediatric patients undergoing bone marrow transplantation. Bone Marrow Transplant. 2001;28:1013-8.
- [Google Scholar]
- Gas chromatographic-mass spectrometric assay for busulfan in biological fluids using a deuterated internal standard. J Chromatogr. 1988;428:357-61.
- [Google Scholar]
- Determination of busulfan in human plasma by gas chromatography with electron-capture detection. J Chromatogr. 1988;425:303-9.
- [Google Scholar]
- Quantitation of busulfan in plasma by high-performance liquid chromatography using postcolumn photolysis. J Chromatogr. 1990;532:429-37.
- [Google Scholar]
- Validation of a high-performance liquid chromatographic assay method for pharmacokinetic evaluation of busulfan. J Chromatogr B Biomed Sci Appl. 1997;692:437-44.
- [Google Scholar]
- Quantification of busulfan in plasma by gas chromatography-mass spectrometry following derivatization with tetrafluorothiophenol. J Chromatogr B Biomed Sci Appl. 1998;709:47-56.
- [Google Scholar]
- Determination of busulfan in human plasma using high-performance liquid chromatography with pre-column derivatization and fluorescence detection. J Chromatogr B Biomed Sci Appl. 1999;730:33-40.
- [Google Scholar]
- High-performance liquid chromatographic method for quantification of busulfan in plasma after derivatization by tetrafluorothiophenol. J Chromatogr B Biomed Sci Appl. 1999;721:147-52.
- [Google Scholar]
- Quantification of busulfan in plasma by liquid chromatography-ion spray mass spectrometry. Application to pharmacokinetic studies in children. J Chromatogr B Biomed Sci Appl. 2001;763:61-9.
- [Google Scholar]
- Tandem mass spectrometry method for the quantification of serum busulfan. Ther Drug Monit. 2005;27:625-9.
- [Google Scholar]
- Quantification of busulfan in plasma using liquid chromatography electrospray tandem mass spectrometry (HPLC-ESI-MS/MS) Methods Mol Biol. 2010;603:129-36.
- [Google Scholar]
- An automated method for supporting busulfan therapeutic drug monitoring. Ther Drug Monit. 2011;33:315-20.
- [Google Scholar]
- A limited sampling strategy for pharmacokinetic directed therapy with intravenous busulfan. Biol Blood Marrow Transplant. 2002;8:619-24.
- [Google Scholar]


