Translate this page into:
Impact of comprehensive cardiovascular risk reduction programme on risk factor clustering associated with elevated blood pressure in an Indian industrial population
Reprint requests: Dr Dorairaj Prabhakaran, Director, Centre for Chronic Disease Control, C1/52, Level 2, Safdarjung Development Area, New Delhi 110 016, India e-mail: dprabhakaran@ccdcindia.org
-
Accepted: ,
This is an open-access article distributed under the terms of the Creative Commons Attribution-Noncommercial-Share Alike 3.0 Unported, which permits unrestricted use, distribution, and reproduction in any medium, provided the original work is properly cited.
This article was originally published by Medknow Publications & Media Pvt Ltd and was migrated to Scientific Scholar after the change of Publisher.
Abstract
Background & objectives:
Cardiovascular risk factors clustering associated with blood pressure (BP) has not been studied in the Indian population. This study was aimed at assessing the clustering effect of cardiovascular risk factors with suboptimal BP in Indian population as also the impact of risk reduction interventions.
Methods:
Data from 10543 individuals collected in a nation-wide surveillance programme in India were analysed. The burden of risk factors clustering with blood pressure and coronary heart disease (CHD) was assessed. The impact of a risk reduction programmme on risk factors clustering was prospectively studied in a sub-group.
Results:
Mean age of participants was 40.9 ± 11.0 yr. A significant linear increase in number of risk factors with increasing blood pressure, irrespective of stratifying using different risk factor thresholds was observed. While hypertension occurred in isolation in 2.6 per cent of the total population, co-existence of hypertension and >3 risk factors was observed in 12.3 per cent population. A comprehensive risk reduction programme significantly reduced the mean number of additional risk factors in the intervention population across the blood pressure groups, while it continued to be high in the control arm without interventions (both within group and between group P<0.001). The proportion of ‘low risk phenotype’ increased from 13.4 to 19.9 per cent in the intervention population and it was decreased from 27.8 to 10.6 per cent in the control population (P<0.001). The proportion of individuals with hypertension and three more risk factors decreased from 10.6 to 4.7 per cent in the intervention arm while it was increased from 13.3 to 17.8 per cent in the control arm (P<0.001).
Interpretation & conclusions:
Our findings showed that cardiovascular risk factors clustered together with elevated blood pressure and a risk reduction programme significantly reduced the risk factors burden.
Keywords
Cardiovascular diseases
clustering
risk factors
risk reduction

Systolic blood pressure (SBP) exceeding 115 mmHg contributes to one-half of ischaemic heart disease (IHD) and cerebrovascular disease (CeVD) around the world1. The major contributors of this global burden of blood pressure (BP) are emerging economies like India and China as a consequence of increased life-expectancy, urbanization, development and affluence2. Several epidemiologic studies have demonstrated that systolic and diastolic BP have a strong, continuous, graded and positive association with cardiovascular disease (CVD) outcomes or life time risk of CVD with no indication of a critical value3–5. Nevertheless, clinical management strategies typically use BP thresholds for interventions to reduce BP associated risk6.
Hypertension appears to cluster with other metabolic risk factors like dyslipidaemia, glucose intolerance, hyperinsulinaemia, obesity, and hyperuricaemia more than would be expected by chance78. In the Framingham study, hypertension in isolation was observed in less than 20 per cent of the time9. The reasons for this metabolic clustering include insulin resistance and sympathetic overactivity. Further, the tendency for these atherogenic traits to cluster with elevated BP increased stepwise with the degree of obesity9. The Indian population is considered a metabolically high risk group and this population is demonstrated to have higher levels of visceral adiposity, insulin resistance, and novel risk markers such as C-reactive protein (CRP), adiponectin and plasma leptin1011. The clustering of CVD risk factors with BP has not been studied before in the Indian population. Demonstration of such clustering is important for formulating risk reduction strategies particularly in individuals with stage I hypertension or prehypertension which are widely prevalent than severe stages of hypertension. Here we report the clustering effect of CVD risk factors with suboptimal BP in a large Indian population and the impact of risk reduction interventions on risk factor clustering.
Material & Methods
Study design: Detailed methodology of the sentinel surveillance study in Indian industrial population (SSIP) has been described previously1213. In brief, from different sites and from both public and private sectors, 10 medium-to-large industries (defined as industries employing 1500-5000 people) in the organized sector were selected, based on their willingness to participate in the study and proximity to an academic medical institution. While all employees were eligible to be part of the study, their family members in the age group of 20 to 69 yr were also included in the survey. The study was approved by the ethics committees of all participating medical colleges and written informed consents were obtained from all study participants. At each participating centre, data were obtained from randomly selected employees and their eligible family members (n= 2000 at each centre). Further, 1000 individuals per centre were chosen by stratified random sub-sampling from this group for biochemical analysis. A total of 19973 (11898 men) individuals consented to participate in this survey in the age group of 20-69 yr at a response rate of 87.6 per cent1213. Biochemical analysis was conducted in 10543 individuals and details on all biochemical risk factors were available in 10442 individuals12.
Trained staff administered survey questionnaires which included questions regarding demographics, lifestyle habits, medications and medical history (including the Rose angina questionnaire)14. The anthropometric profile was measured using standard procedures and equipment. Blood pressure was measured using automated BP monitoring equipment (Omron MX3). Two measurements were taken at least 5 min apart and before collecting the blood samples. Study subjects were instructed in advance not to consume any drinks and tobacco at least 1 h before attending the screening clinic. Fasting blood samples were also collected after 10-12 h of fasting biochemical analysis of blood glucose and lipids. Ten per cent of the biochemical samples were reanalyzed at the central co-ordinating centre laboratory in the department of Cardiac Biochemistry, All India Institute of Medical Sciences, New Delhi, India. The analysis of the results of this 10 per cent sample from all participating sites yielded less than 5 per cent coefficient of variation between the central co-ordinating laboratory results and the individual laboratory results.
All industrial sites were invited to participate in a health intervention programme after the completion of the baseline survey. While six of the ten sites agreed to participate in the intervention phase (intervention arm) and one site agreed to participate only in a repeat risk factor survey (control arm). A comprehensive CVD risk reduction programme was implemented by trained, locally stationed, project health care personnel in the participating industries over four consecutive years. The components of the interventions programme are published in detail elsewhere15. In brief, a population-based approach was the mainstay of the intervention, which was augmented by high-risk and policy change/environmental approaches. Workplaces organized individual and group counselling sessions, health melas (displays), cooking competitions, and dance classes. Posters, banners, handouts, booklets, and real-time videos with simple, captivating messages translated in seven Indian languages were used for health education. Management and employees initiated changes like increasing salads and decreasing salty and fried foods in canteen menus, and enforcing smoking bans. High-risk individuals identified through screening were referred to the on-site health facilities for risk management; individual and group counselling were also offered. On-site health staff were trained and provided treatment guidelines and targets to implement global absolute CVD risk (the probability of experiencing a cardiovascular event in future on the basis of current risk factors) reduction efforts. The control site referred high risk individuals for follow up and banned tobacco use, but implemented no other aspects of the intervention.
The intervention programme was started in 2003 and extended until the end of 2006. After the intervention programme, another independent subsample (n; intervention arm=5899 and control arm=907) of the population (selected by age group in deciles and sex stratified random sample) was re-examined in 2006 to 200715. The change in risk factor clustering with blood pressure before and after the intervention was analysed in the independent cross-sectional samples as well as in a cohort of 1982 intervention and 349 control subjects.
Definitions
Current tobacco use was defined as use of any form of tobacco products (smoking and smokeless form) in the previous 30 days. Overweight was defined as body mass index (BMI) >25 kg/m2 16. Central obesity was defined as waist circumference (WC) >94 cm in males and WC >88 cm in females based on the modified National Cholesterol Education Program Adult Treatment Protocol III (NCEP ATP III) criteria of metabolic syndrome17.
Hypertension (BP Group 3; HTN) was defined as either a systolic blood pressure (SBP) >140 mmHg, and/or a diastolic blood pressure (DBP) >90 mmHg, or on drug treatment for hypertension18. Pre-hypertension (BP Group 2; preHTN) was defined as either a SBP of 120-139, and/or a DBP of 80-89 mmHg and not on anti-hypertensive drug therapy18. BP Group 1 (BP-1) was defined by a SBP 115-119 or DBP 75-79 mmHg. BP group 0 (BP-0) was defined by a SBP <115 and DBP <75 mmHg.
Diabetes was defined as either a fasting blood glucose value of >126 mg/dl19 or on medication for diabetes. Impaired fasting glucose (IFG) was defined as a fasting blood glucose value >110 mg/dl17. Dyslipidaemia was defined as total cholesterol to high-density lipoprotein ratio (TC/HDL) of >4.5. Hypertriglyceridaemia was defined as triglycerides (TG) >150 mg/dl17.
Low risk phenotype was defined as individuals with BP below 115/75 mmHg, BMI < 25 kg/m2, WC <94 cm in males and WC <88 cm in females, fasting blood glucose <110 mg/dl, TC/HDL <4.5, TAG <150 mg/dl and non smokers.
Coronary heart disease (CHD) was defined as physician confirmed myocardial infarction or unstable angina or symptoms suggestive of CHD from the Rose angina questionnaire.
Statistical analysis: The analysis evaluated both the direction and magnitude of the association between BP and other CVD risk factors. The study group was divided into four different BP strata (BP groups 0-3). The mean levels of cardiovascular risk factors were compared across these four groups, using analysis of variance (ANOVA), after adjusting for differences in education and occupation. In total, six risk factors (overweight, central obesity, IFG, dyslipidaemia, hypertriglyceridaemia and current use of tobacco) were considered for calculation of total number of additional risk factors in each individual. Information on all six risk factors included in the analysis and BP measurements were available in 10396 individuals. The trends in mean number of additional risk factors across BP groups at different individual risk factor levels were compared by plotting line graphs. Linear regression with multiple covariates was used to identify unit change in BP with stepwise addition of number of CVD risk factors (0-6). Multiple logistic regression method was employed to identify the risk of CHD in individuals with hypertension and pre-hypertension based on presence of number of other risk factors. Mean levels of individual risk factors were compared across different groups (0, 1, 2, 3+ CVD risk factors) using ANOVA.
The trend in mean number of accompanying risk factors across BP groups before and after intervention (among common individuals who have attended both the surveys) was compared by plotting line graphs separately for the intervention and control arms. The data were analyzed by using the Statistical Package for Social Sciences Version 15 (SPSS, Inc., Chicago, IL).
Results
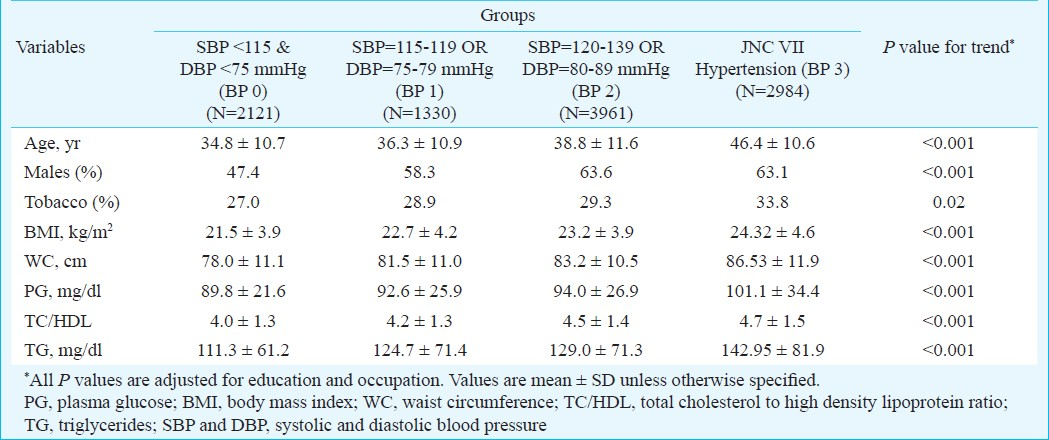
Demographic characteristics: The mean age of the study population was 40.9 ± SD 11.0 yr. More than half (63%) of the study subjects were males. Nearly three quarters (74%) of the study group had at least secondary school education, while 11 per cent were illiterate. Less than one third of the study population comprised both unemployed or retired individuals (9%) and home makers (22%). The prevalence of the four BP categories were BP-0 20, BP-1 13, preHTN 38 and HTN 29 per cent (Table I). A significant (P<0.001) and graded increase in mean level of all CVD risk factors from the lowest BP group to the hypertension group was observed. Tobacco use was highest in subjects with HTN (33.8%), lowest in the BP-0 (27.0%). BP-1 and preHTN groups had similar proportion of tobacco users (29.3 and 28.9%, respectively).
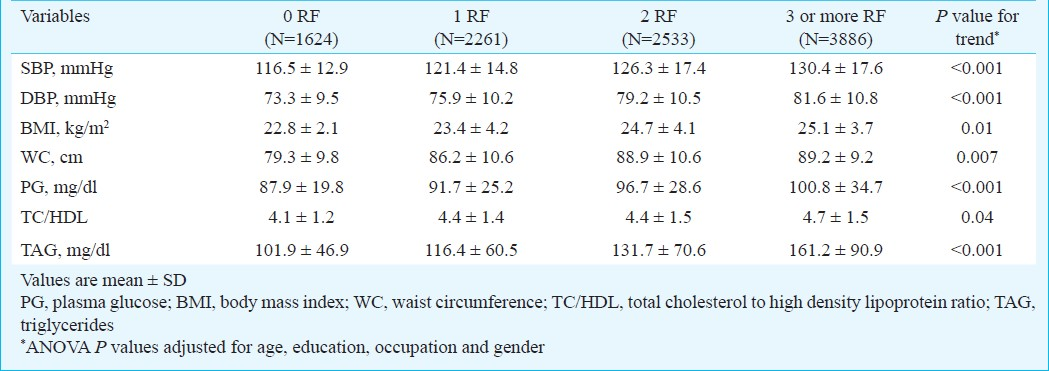
Overall burden of metabolic risk factors and risk factor clustering: A linear increase in the number of additional risk factors with increasing BP irrespective of stratification using different risk factor thresholds was observed, except for smoking (Fig. 1). While the number of additional risk factors increased with BP in non-smokers, this effect was not seen in smokers. In a linear regression model, after adjustment for age, education, occupation and gender, each additional risk factor was associated with an increase in SBP by 3.6 mmHg (95% CI: 3.34-3.78, P<0.001) and DBP by 1.4 mmHg (95% CI: 1.25-1.56, P<0.001). The mean levels of BMI, WC, plasma glucose, TC/HDL ratio and TG were also associated with linear increase of risk factors (Table II).
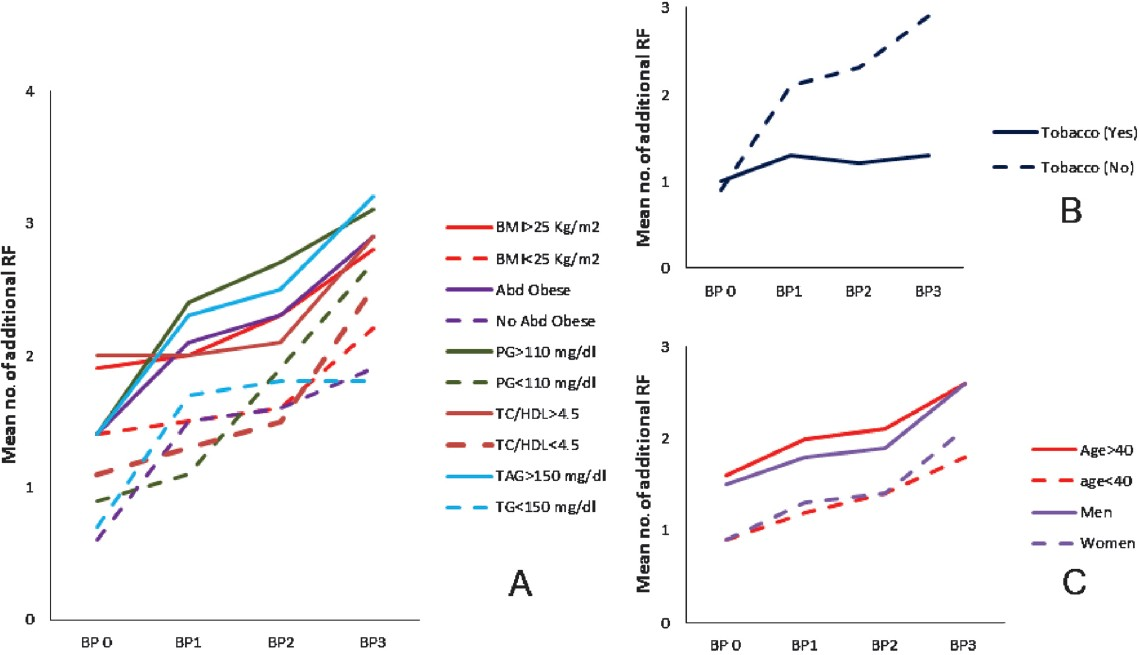
- Risk factor clustering with BP groups stratified by individual risk factor levels (baseline population). A: Stratified by metabolic risk factors (RF), B: Stratified by tobacco use, and C: Stratified by age and gender. PG, plasma glucose; BMI, body mass index; Abd Obese, abdominal obesity; TC/HDL, total cholesterol to high density lipoprotein ratio; TG, triglycerides.
The clustering of risk factors was not restricted to hypertension alone, but also seen with other metabolic risk factors (Fig. 2). However, the spectrum and burden of clustering was different for these risk factors. In isolation, fasting glucose >110 mg/dl occurred in 1.2 per cent, BMI>25 kg/m2 in 3.7 per cent, central obesity in 2.5 per cent, TC/HDL>4.5 in 6.9 per cent, TG>150 mg/dl in 3.7 per cent and HTN in 2.6 per cent of the population. The prevalence of >3 additional risk factors in each of these risk groups increased by 5.4, 2.4, 4.2, 1.8, 3.0, 4.8 times, respectively. However in real terms, HTN with a 4.8 fold increase had 12.3 per cent prevalence of individuals with 3 or more risk factors, while dysglycaemia with a 5.4 fold increase had only 6.3 per cent of the population with 3 or more additional risk factors.
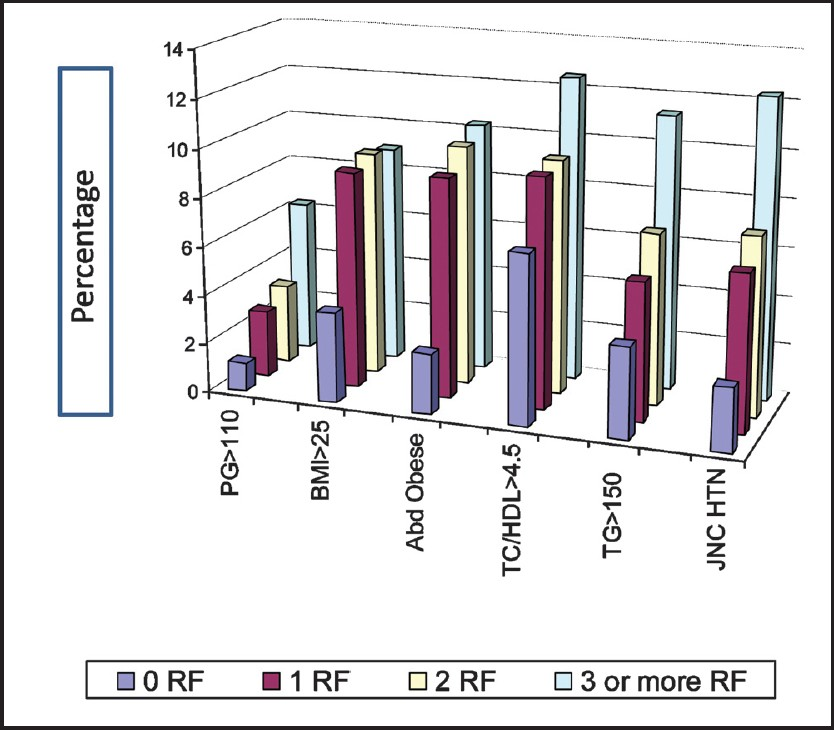
- Overall burden of individual metabolic risk factors of CVD stratified by number of accompanying risk factors (baseline population). RF, Risk factor(s); PG, plasma glucose in mg/dl; BMI, body mass index in kg/m2; Abd Obese, abdominal obesity (cm); TC/HDL, total cholesterol to high density lipoprotein ratio; TG, triglycerides in mg/dl; JNC HTN, Joint National Council hypertension.
Prevalent CHD, BP groups and risk factor clustering: A total of 263 CHD prevalent cases with complete risk factor information were identified (among 10 304 participants). Compared to normotensive individuals (BP-0, BP-1, preHTN), the OR for CHD in HTN individuals with no additional risk factors was 1.99 (95% CI: 1.05-2.96, P=0.035) after adjustment for age, sex, education and occupation. The OR increased to 2.02 (95% CI: 1.36-2.68, P<0.001), 2.52 (95% CI: 1.72-3.4, P<0.001), and 3.4 (95% CI: 2.63-4.2, P<0.001) for individuals with one, two and three or more risk factors, respectively (Fig. 3). Compared to normotensive individuals (BP-0 and BP-1), participants in the preHTN group had significantly increased risk for CHD with two risk factors (OR=1.34, 95% CI: 1.05-1.64, P=0.045), as well as >3 risk factors (OR=1.79, 95% CI: 1.17-2.45, P=0.007) (Fig. 3). However, the OR was 0.68 (95% CI: 0.25-1.21) in individuals with preHTN and one additional risk factor.
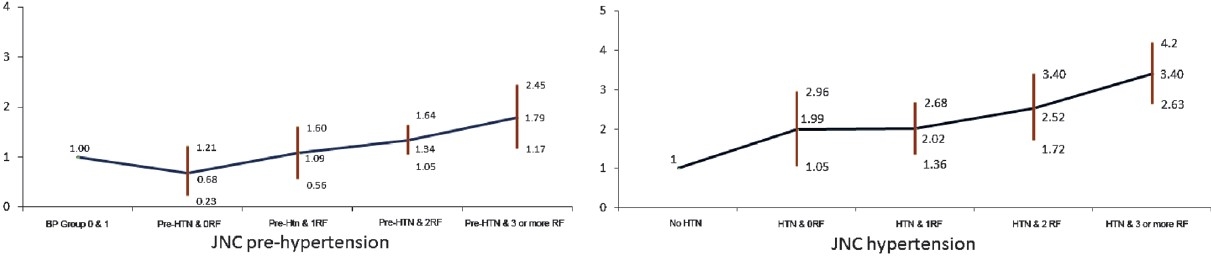
- OR and 95% CI of OR for CHD in hypertension and pre-hypertension (baseline population). *Odds ratio (OR) are adjusted for age, sex, education and occupation. JNC HTN, Joint National Council VII Hypertension; JNC Pre-HTN, Joint National Council VII Prehypertension; HTN, hypertension; BP 3, systolic BP 110-119 or diastolic BP 75-79 mm of Hg and non-hypertensives; BP 4, systolic BP less than 110 and diastolic BP less than 75 mm of Hg and non-hypertensives; RF, risk factors.
Impact of interventions on risk factor clustering across BP groups: Cross-sectional data comparison: In the independent cross-sectional samples, the proportion of individuals with ‘low-risk phenotype’ increased from 13.4 to 19.9 per cent in the intervention arm but decreased from 27.8 to 10.6 per cent in the control arm (P<0.001). Concomitantly, the proportion of individuals with hypertension and >3 risk factors decreased from 10.6 to 4.7 per cent in the intervention arm but increased from 13.3 to 17.8 per cent in the control arm.
Cohort comparison: While the mean number of risk factors reduced after the risk reduction programme across all the BP groups in the intervention arm, it increased in the control arm (Fig. 4). For example, in the intervention arm the mean number of additional risk factors decreased from 1.4 (SD=1.1) to 0.8 (SD=0.7) in BP group 0, and from 2.4 (SD=1.3) to 1.3 (SD=1.1) in BP group 3 (P<0.001). By contrast in the control arm, it increased from 1.3 (SD=1.1) to 1.6 (1.2) and from 2.3 (1.5) to 2.4 (1.5) in the BP group 0 and 3, respectively. Both within group differences (differences before and after the intervention) and between groups difference (differences between intervention arm and control arm) were statistically significant after adjustment for age, sex and education (P<0.001).
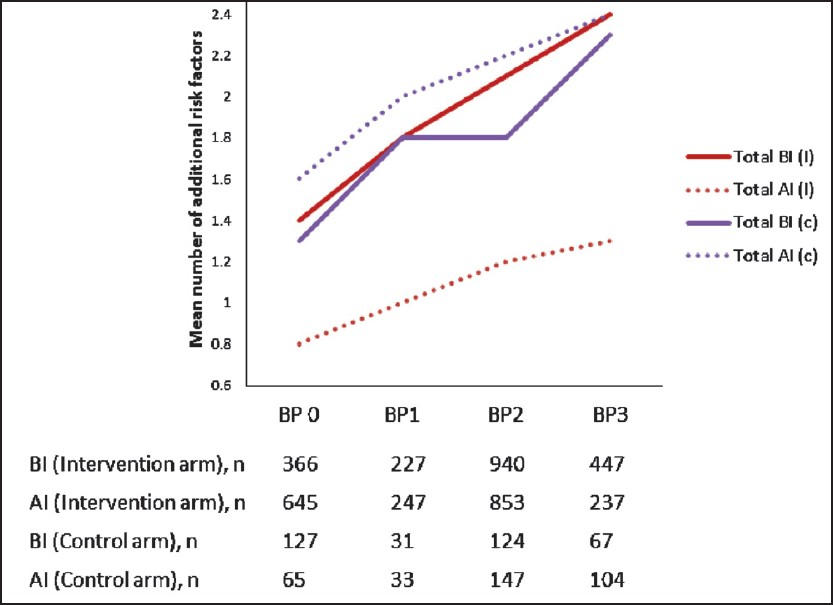
- Impact of intervention on clustering of CVD risk factors stratified by blood pressure levels. BI, before interventions; AI, after interventions; (I), intervention arm; (c), control arm.
Discussion
Our study in more than 10,000 individuals demonstrates that the burden of cardiovascular risk imposed by BP is associated with clustering of other metabolic risk factors. There was a linear increase in number of additional risk factors with increasing BP irrespective of stratification using different risk factor thresholds. However, this metabolic clustering was not unique to hypertension and was seen with other metabolic risk factors with varying degree. The clustering of metabolic risk factors seen with increasing levels of each risk factor suggests a common link that promotes the progression of each of these risk factors.
Among individuals with hypertension and pre-hypertension only 9 and 16.8 per cent had hypertension and pre-hypertension in isolation, respectively and this is lower than other published studies. In the Framingham study, hypertension was found in isolation in 20 per cent of the hypertensive subjects9. However, our population was relatively young and included only employees in various industrial settings in India and their family members. The associations between elevated BP and presence of multiple CVD risk factors have been published in several studies and our results are consistent with those920–24.
While the Indian population is considered to be a metabolically high risk population, risk factor clustering with elevated BP has not been studied before. Regional studies from India with relatively small sample size looked at clustering effect with insulin resistance2526 one of the possible determinants of clustering, with inconclusive results. While one study highlighted a significant relationship between insulin resistance and clustering of risk factors26 the other one could not establish such a relationship25. This indicates that the underlying processes that result in risk factor clustering are not restricted to the previously thought of, common link, ‘insulin resistance’ alone and other factors may be involved.
Tobacco use in any form is an established risk factor for CVD and a significant confounder in the clustering effect of metabolic risk factors. In a three-year follow up study, former smokers had significantly higher risk for developing metabolic syndrome than sustained smokers or new smokers27, which may be partly explained by the inverse relationship between smoking and BMI. A very large study covering almost 100,000 adults from India also demonstrated significantly lower levels of BMI in individuals using any form of tobacco28. Tobacco use abolished risk factor clustering associated with increasing BP in our data mainly because of relatively low proportion of overweight and abdominal obesity in this group in comparison to non-users. However, current literature also shows that tobacco smoking raises insulin resistance and increases metabolic syndrome through mechanisms other than weight gain29. Further, males and individuals older than 40 yr show more pronounced risk factor clustering. Nearly 40 per cent of participants older than 40 yr had three or more risk factors across the BP groups and it was highest in individuals with hypertension (47.3%).
Hypertension independently contributes to the risk of CHD, but its impact is greatly influenced by associated risk factors. As expected in our analysis, the OR for CHD increased with addition of one or more of the established risk factors along with hypertension. The OR for CHD was significantly elevated in participants with pre-hypertension and two or more additional CVD risk factors. Because of the tendency of other CVD risk factors to cluster with elevated BP, it is important to assess the global absolute CVD risk, especially among person with moderate BP elevations.
The clustering effect of CVD risk factors in the Indian population appears reversible and amenable to interventions. We had earlier described that the risk reduction programme significantly reduced mean risk factor levels in the intervention population in comparison to the control population15. Additionally, the risk reduction was consistent across the BP groups. The interventions reduced the risk factor clustering by almost one risk factor in the pre-hypertensive and hypertensive individuals, while there was an increase in mean number of accompanying risk factors in the control population.
The proportion of study population with ‘low risk phenotype’ increased significantly in the intervention population, while it decreased in the control population. The change observed in the control arm probably reflects the secular trend whereas the change observed in the intervention arm reflects the impact of intervention. In the Framingham heart study participants, those with optimal risk factor levels (total cholesterol <180 mg/dl, BP <120/80 mmHg, non-smoker and non-diabetic) had substantially lower life time risk of cardiovascular events (5.2 versus 68.9% in men, 8.2 versus 50.2% in women) and markedly longer median survivals (>39 versus 28 yr in men, >39 versus 31 yr in women) in comparison to participants with two or more of these risk factors30.
Our study had several limitations. First, the data analyzed were from a cross-sectional survey and thus the results demonstrated associations but did not provide evidence for causality. Second, the study population was mainly composed of industrial employees and their family members and may not be representative of the general population. However, inclusion of family members and selection of ten different study sites from different parts of the country in a variety of industrial settings ranging from tea garden industry to aeronautics engineering company improved the external validity of the study. Third, the study participants had access to industry-provided health care facilities, which might have increased their health-seeking behaviour relative to the general population. Fourth, the study participants were relatively young, and the proportion of study subjects >60 yr was limited, where CVD risk factor clustering is even greater. Finally, the cohort analysis was carried out in a sub-population of attendees of both surveys. The baseline characteristics of both cohort attendees and non-attendees are published earlier and differ only in terms of education15. The statistical analysis accounted for this difference and the results are adjusted for education. This study demonstrates that a comprehensive cardiovascular risk reduction programme is effective in reducing the average number of risk factors in different blood pressure groups. It would be difficult to find out the interventions with maximum impact. The argument that the impact of treatment is reflected in the risk reduction may not be true as we have demonstrated significant risk reduction even at lower levels of blood pressure where drug treatment is not recommended.
In conclusion, our study in an Indian industrial population showed that cardiovascular risk factors clustered with elevated BP and significantly increased CHD risk. Since absolute cardiovascular risk increases with the addition of other risk factors, it is important for clinicians to screen all other risk factors in patients with elevated BP and manage them effectively. CVD risk reduction programme reverse the RF factors clustering associated with elevated BP and increase the proportion of individuals with ‘low risk phenotype’.
Acknowledgment
Authors acknowledge the World Health Organization and Ministry of Health and Family Welfare, Government of India, New Delhi, for financial support. Authors acknowledge all participating Centres and PIs associated with this study. P Jeemon is supported by a Wellcome Trust Capacity Strengthening Strategic Award to the Public Health Foundation of India and a consortium of UK Universities.
References
- The burden of blood pressure-related disease: a neglected priority for global health. Hypertension. 2007;50:991-7.
- [Google Scholar]
- Age-specific relevance of usual blood pressure to vascular mortality: a meta-analysis of individual data for one million adults in 61 prospective studies. Lancet. 2002;360:1903-13.
- [Google Scholar]
- Risk of cardiovascular events among women with high normal blood pressure or blood pressure progression: prospective cohort study. BMJ. 2007;335:432.
- [Google Scholar]
- Blood pressure, stroke, and coronary heart disease. Part 1, Prolonged differences in blood pressure: prospective observational studies corrected for the regression dilution bias. Lancet. 1990;335:765-74.
- [Google Scholar]
- National Institute for Health and Clinical Excellence (NICE) website. Available from: http://www.nice.org.uk/CG034guidance
- [Google Scholar]
- Cardiovascular risk stratification according to the 2003 ESH-ESC guidelines in uncomplicated patients with essential hypertension: comparison with the 1999 WHO/ISH guidelines criteria. Blood Press. 2004;13:144-51.
- [Google Scholar]
- Cardiovascular risk stratification in unselected primary care patients with newly detected arterial hypertension. Hypertens Res. 2010;33:607-15.
- [Google Scholar]
- Risk stratification in hypertension: new insights from the Framingham Study. Am J Hypertens. 2000;13:3S-10S.
- [Google Scholar]
- Body composition, visceral fat, leptin, and insulin resistance in Asian Indian men. J Clin Endocrinol Metab. 1999;84:137-44.
- [Google Scholar]
- The lifecycle effects of nutrition and body size on adult adiposity, diabetes and cardiovascular disease. Obes Rev. 2002;3:217-24.
- [Google Scholar]
- Methods for establishing a surveillance system for cardiovascular diseases in Indian industrial populations. Bull World Health Organ. 2006;84:461-9.
- [Google Scholar]
- Educational status and cardiovascular risk profile in Indians. Proc Natl Acad Sci USA. 2007;104:16263-8.
- [Google Scholar]
- The diagnosis of ischaemic heart pain and intermittent claudication in field surveys. Bull World Health Organ. 1962;27:645-58.
- [Google Scholar]
- Impact of a worksite intervention program on cardiovascular risk factors: a demonstration project in an Indian industrial population. J Am Coll Cardiol. 2009;53:1718-28.
- [Google Scholar]
- World Health Organization. In: Obesity. Preventing and managing the global epidemic. Report of a WHO Consultation on Obesity. Geneva, Switzerland: World Health Organization; 1998.
- [Google Scholar]
- Expert Panel on Detection, Evaluation, and Treatment of High Blood Cholesterol in Adults. Executive Summary of the Third Report of the National Cholesterol Education Program (NCEP) Expert Panel on Detection, Evaluation, and Treatment of High Blood Cholesterol in Adults (Adult Treatment Panel III) JAMA. 2001;285:2486-97.
- [Google Scholar]
- National Heart, Lung, and Blood Institute Joint National Committee on Prevention, Detection, Evaluation, and Treatment of High Blood Pressure; National High Blood Pressure Education Program Coordinating Committee. The Seventh Report of the Joint National Committee on Prevention, Detection, Evaluation, and Treatment of High Blood Pressure: the JNC 7 report. JAMA. 2003;289:2560-72.
- [Google Scholar]
- Definition, diagnosis and classification of diabetes mellitus and its complications.Part 1: diagnosis and classification of diabetes mellitus; bbrprovisional report of a WHO consultation. Diabet Med. 1998;15:539-53.
- [Google Scholar]
- Association between prehypertension and clustering of cardiovascular disease risk factors among Chinese adults. J Cardiovasc Pharmacol. 2009;53:388-400.
- [Google Scholar]
- Clustering of cardiovascular risk factors in confirmed prehypertensive individuals. Hypertension. 1992;20:38-45.
- [Google Scholar]
- Impact of high-normal blood pressure on the risk of cardiovascular disease. N Engl J Med. 2001;345:1291-7.
- [Google Scholar]
- Prevalence of prehypertension and its relationship to risk factors for cardiovascular disease in Jamaica: analysis from a cross-sectional survey. BMC Cardiovasc Disord. 2008;8:20.
- [Google Scholar]
- High-normal blood pressure is associated with a cluster of cardiovascular and metabolic risk factors: a population-based study. J Hypertens. 2009;27:102-8.
- [Google Scholar]
- Insulin resistance alone does not explain the clustering of cardiovascular risk factors in southern India. Diabet Med. 2000;17:152-7.
- [Google Scholar]
- Clustering of cardiovascular risk factors in urban Asian Indians. Diabetes Care. 1998;21:967-71.
- [Google Scholar]
- Association of smoking status, weight change, and incident metabolic syndrome in men: a 3-year follow-up study. Diabetes Care. 2009;32:1314-6.
- [Google Scholar]
- Association between tobacco use and body mass index in urban Indian population: implications for public health in India. BMC Public Health. 2006;6:70.
- [Google Scholar]
- Prediction of lifetime risk for cardiovascular disease by risk factor burden at 50 years of age. Circulation. 2006;113:791-8.
- [Google Scholar]


