
Translate this page into:
Sweat conductivity test - can it be a cheaper alternative to sweat chloride analysis for diagnosis of cystic fibrosis in low resource setting?
For correspondence: Dr Priyanka Medhi, Department of Child Health (Paediatric Pulmonology), Christian Medical College, Vellore 632 004, Tamil Nadu, India e-mail: emmanuel_priyanka@yahoo.com
-
Received: ,
Accepted: ,
Abstract
Background & objectives
Availability of sweat chloride analysis, the gold standard test for diagnosis of Cystic Fibrosis (CF) faces significant challenges in India. This study aimed to compare sweat conductivity using Sweat-Chek™ Sweat Analyzer against sweat chloride analysis using the 926 Sherwood chloride analyser and assess if sweat conductivity test can guide CF diagnosis in resource-poor settings.
Methods
In this retrospective study sweat chloride analysis and sweat conductivity were simultaneously performed on samples collected via Macroduct® system from patients referred for sweat testing. CF diagnosis was based on sweat chloride levels: ≥60 mmol/l confirmed CF, 30-59 mmol/l was borderline, and <30 mmol/l excluded CF. Sensitivity, specificity, positive predictive value (PPV) and negative predictive value (NPV), and area under curve (AUC) were calculated via ROC curve. Spearman’s rho was employed to analyse the correlation between methods.
Results
Both tests were performed on 118 children of which 106 samples were adequately collected. CF was diagnosed in 11 children. Sweat conductivity ≥ 80 mmol/l diagnosed CF with 100 per cent sensitivity, specificity, PPV, and NPV. Likewise, a value ≤ 49 mmol/l predicted absence of CF with 100 per cent sensitivity, 91.36 per cent specificity, 78.13 per cent PPV, and 100 per cent NPV. Spearman’s rho of 0.93 (P< 0.001) showed a strong correlation between the two methods. Intermediate conductivity values also correlated well (rs 0.62, P< 0.003) with intermediate sweat chloride levels.
Interpretations & conclusions
Sweat conductivity reliably identified CF in the study population including those children with borderline levels, suggesting the possibility of its use in resource-limited settings where sweat chloride analyzers are unavailable.
Keywords
Cystic fibrosis
cystic fibrosis transmembrane conductance regulator
nanoduct
pilocarpine nitrate
sweat conductivity
sweat chloride analysis

Cystic fibrosis (CF) is a life-shortening autosomal recessive disease characterised by fat malabsorption, poor growth, and recurrent sino-pulmonary infections. It is caused by mutations in the cystic fibrosis transmembrane conductance regulator (CFTR) gene located on the long arm of chromosome 71-3. CFTR protein serves as a chloride channel on the epithelial cell surface. Mutations in the CFTR gene result in absent or deficient CFTR protein function, thus causing various organ pathologies. In the sweat ducts, abnormal CFTR protein prevents the reabsorption of chloride and sodium from the secreted sweat as it traverses through the ducts to be excreted on the skin surface4. This results in the excretion of sweat with high electrolyte content, the patient, thus facing devastating consequences of dys-electrolytaemia, especially during summers5,6. This observation led to the development of the sweat chloride test by Gibson and Cooke in 1959, and since then it has remained the gold-standard diagnostic test7. Values ≥60 mmol/l are considered diagnostic of CF.
Existing literature shows that sweat conductivity measurement has a good correlation with sweat chloride analysis8,9. Sweat conductivity test measures the capacity to conduct electrical current through sweat, which mainly depends on the concentration of positive and negative ions, the bulk of which are sodium and chloride ions, respectively. Guidelines by the National Committee for Clinical Laboratory Standards (NCCLS) and the Cystic Fibrosis Foundation (CFF) classify sweat conductivity test as a screening test for CF and recommend that a value more than 50 mmol/l should be confirmed by a quantitative sweat chloride analysis10,11.
Variability in sweat chloride levels across ethnicities is documented, but data on sweat conductivity variability is limited. A few studies have reported a good correlation between the two tests in non-Caucasian groups, though none are from Asia8,9. In India, clinicians often rely on sweat conductivity for CF diagnosis due to its lower cost. In this study, we compared the performance of the sweat conductivity test against sweat chloride analysis by carrying out both tests on the same sweat sample collected by Macroduct® Sweat Collection System (Wescor, Logan, UT, USA).
Materials & Methods
This retrospective study analysed CF diagnostic testing data from February 2017 to January 2018 and was conducted at the department of Biochemistry, Christian Medical College and Hospital, Vellore, a tertiary referral centre in Southern India. Institutional review board (IRB) clearance was obtained before data collection, and consent was waived due to the retrospective nature of the study. The objectives of this study were to compare values obtained by sweat conductivity test using the Sweat Chek system against those by quantitative sweat chloride analysis on sweat samples collected by pilocarpine iontophoresis from study participants from the Indian subcontinent. De-identified data were analysed. We also examined the level of correlation between diagnostic and intermediate-range sweat chloride values with corresponding sweat conductivity values when performed on the same sweat samples.
Inclusion criteria
Participants in whom CF was suspected and who were referred for sweat testing were included if an adequate sweat sample was obtained for both tests.
Study protocol
Up till 2016, diagnosis of CF in our institution was done by sweat conductivity testing. On procuring equipment for quantitative sweat chloride analysis, both tests were done on the same sweat samples for quality check. In the present study, available data on the results of sweat tests by both methods were compared. Sweat induction and collection were done either at the bedside of the patient or in the laboratory (for ambulatory patients), and the collected samples were immediately analysed. Sweat chloride value of ≥60mmol/l was considered as diagnostic of CF.
Procedure of sweat induction for conductivity and sweat chloride analysis
For sweat induction, the skin of the forearm was cleaned with 70 per cent alcohol, wiped with deionized water, and dried completely. Then, iontophoretic stimulation was done using two copper electrodes holding agar disks, containing pilocarpine nitrate solution (0.5%) strapped to the cleaned forearm. The electrodes were connected to a battery-operated current source, which delivers a maximum current of 1.5 mA for 5 min (Supplementary Table). After completion of iontophoresis, the electrodes were removed, and the skin was cleaned with deionised water and dried with a cotton swab without delay. The Macroduct® Sweat Collection System (ELITechGroup Inc. Logan, Utah, USA) (Supplementary Table) was then placed over the area where the positive electrode was placed and sweat collected. The collected sweat was then used to perform both assays within 20 min of sample collection.
Principle of conductivity method and procedure
The sweat sample was analysed using 3120 Sweat-Chek™ Sweat Analyzer (Wescor Inc, Logan. UT, USA) according to the manufacturer’s instructions (Supplementary Table). Quality control (ELITech Group Inc Utah, USA) was run along with the sample analysis. The measuring cell was cleaned thoroughly with deionised water and air-dried after each sample to prevent any carry-over from previous analyses.
After the sweat collection was over, the spiral collection tube was detached from the Macroduct® sweat Collection System and attached to the inlet of the Sweat-Chek™ Sweat Analyzer. It was then injected into the conductivity cell using a clean dry syringe connected to the end of the spiral tube and allowed to stand for a minute for readings to stabilise. The equipment measured the conductivity of the specimen using electrodes and converted it into equivalent sodium chloride molarity, and the result was displayed.
Principle of sweat chloride analysis test and procedure
The sweat chloride concentration estimation was performed using a 926 Sherwood chloride analyser (Sherwood Scientific Ltd., Cambridge, UK) (Supplementary Table) based on the principle of coulometric titration. Instrument titrates chloride by passing a constant current between two silver electrodes, which generates silver ions. These silver ions combine with the chloride in the sample to form silver chloride in the acid buffer.
The sweat sample collected was transferred to a clean, dry vial, and 20 µl of sweat was pipetted out to the titration vessel containing 14 ml of buffer solution. Once all chloride ions from the sweat sample get used up in the reaction to form silver chloride, free silver ions appear in the solution, causing a sudden change in conductivity. This change is detected by the sensing electrodes and results are displayed directly in millimoles per litre. Once the readout in the instrument is stabilised, results are displayed as mmol/l chloride.
At the end of each test, values of sweat conductivity and sweat chloride analysis were entered in the laboratory register. For the study, the Principal Investigator collected all the test values and relevant demographic and clinical information into a data entry sheet for analysis.
Statistical analysis
The Mean (SD) and Median (range) were reported for continuous data. The number (with percentage) was reported for the categorical data. A box plot was presented to show the distribution of the quantitative sweat chloride level (<30, 30-59, and ≥60 mmol/l). The scatter plot was presented to visually assess the correlation between two continuous variables. Pearson correlation coefficient (r) was estimated to find the relationship between two continuous variables. Nonparametric Spearman rank correlation was used to assess the correlation between two continuous skewed variables. The receiver operating characteristic (ROC) curve was drawn to find the capability of the sweat conductivity test in discriminating CF from non-CF subjects. Diagnostic statistics such as sensitivity, specificity, positive predictive value, and negative predictive values were reported. All tests were two-sided at α=0.05 level of significance. All analyses were done using Statistical Package for Social Sciences (SPSS) software Version 21.0 (IBM Corp, Armonk, NY, USA).
Results
During the study period, 118 study participants underwent sweat testing in our laboratory; 106 of them aged three months to 55 yr (median age of 6 yr) fulfilled the inclusion criteria. Eleven study participants were above the age of 18. A diagnosis of CF was established in 11 (10.4%) study participants based on a cut-off ≥60 mmol/l sweat chloride level measured via sweat chloride analysis. Table I gives the clinical characteristics of study participants with CF (pwCF) and those without CF.
| Characteristics |
Study participants with CF (n=11) , n (%) |
Non-CF Study participants (n=95), n (%) | |||
|---|---|---|---|---|---|
| Age (yr), mean±SD | 8.3±15.8 | 8.5±9.4 | |||
| Age categories (yr) | <2 | 0 | 20 (21) | ||
| 2 to <6 | 4 (36) | 28 (29) | |||
| 6 to <18 | 6 (55) | 37 (39) | |||
| 18 & above | 1 (9) | 10 (11) | |||
| Female gender | 4 (36) | 32 (34) | |||
| Residence | |||||
| India | 8 (73) | 84 (88) | |||
| Bangladesh | 3 (27) | 11 (12) | |||
| Symptoms at referral for sweat test | |||||
| Respiratory symptoms (persistent cough/bronchiectasis) | 11 (100) | 43 (45) | |||
| Gastrointestinal symptoms (history of meconium ileus at birth/oily stools/chronic diarrhoea/cholelithiasis) | 7 (64) | 21 (22) | |||
| Failure to thrive | 6 (55) | 13 (14) | |||
| Recurrent/chronic pancreatitis | 1 (9) | 9 (10) | |||
| Family history of CF | 2 (18) | 0 | |||
| Sweat chloride levels & sweat conductivity | |||||
|
Sweat tests (mmol/l) |
Quantitative sweat-chloride analysis | Sweat conductivity test | Quantitative sweat-chloride analysis | Sweat conductivity test | |
| Mean ± SD | 79.1 (17) | 102.2 (14) | 16.9 (9.2) | 40.1 (12.2) | |
| Median | 82 | 99 | 14 | 38 | |
| Range (mmol/l) | 61 - 106 | 87 - 123 | 7 - 45 | 25 - 79 | |
| Pearson correlation coefficient (r) | 0.896 | 0.915 | |||
CF, cystic fibrosis; SD, standard deviation
A Spearman’s rho value of 0.93 (P<0.001) was obtained by performing a correlation analysis between the two diagnostic methods. Figures 1A and B show the frequency distribution of sweat conductivity values plotted against the cohort’s sweat chloride analysis values.
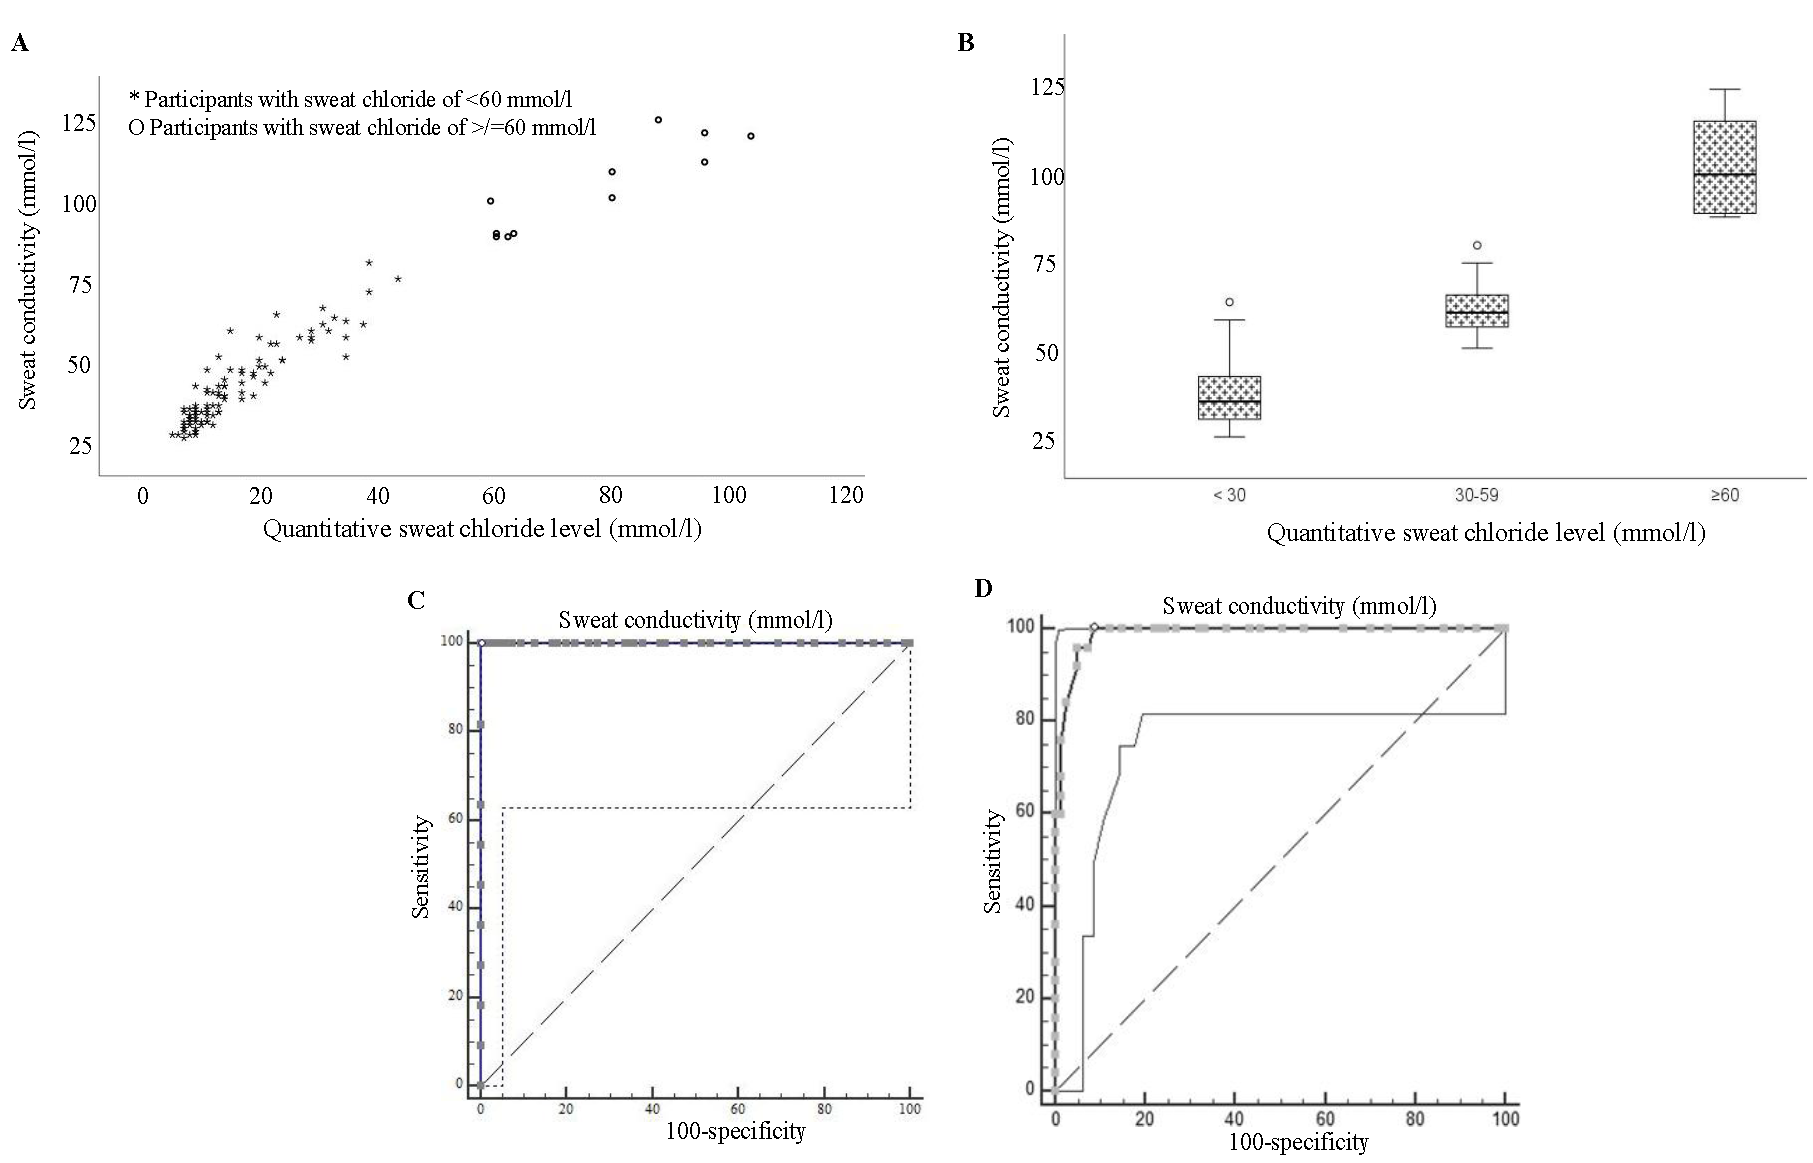
- The frequency distribution of sweat conductivity values plotted against sweat chloride analysis values for those with and without CF (A) revealed no overlap. (B) It illustrates that the study participants with normal and diagnostic values are clearly separated from each other. ROC curves for sweat conductivity as a diagnostic test for CF(C) shows AUC for diagnosis of CF, and (D) shows AUC for ruling out CF.
An ROC curve was constructed to check the capability of the sweat conductivity test in discriminating CF from non-CF. The area under the ROC curve (AUC) for sweat conductivity measurement as a diagnostic test for CF was 1 (Fig. 1C), indicating that this test could perfectly distinguish between individuals with CF and those without. The cut-off >79 mmol/l was the optimal cut-off point for distinguishing between CF positive and negative individuals.
An AUC of 0.988 was obtained under ROC curve plotted to assess the ability for sweat conductivity in separating normal individuals (sweat Chloride level of <30 mmol/l) from those with borderline high sweat chloride levels (30 to 59 mmol/l) (Fig. 1D).The optimal threshold of >49 mmol/l provided perfect sensitivity and high specificity, making it an excellent diagnostic tool to rule out CF in a patient.
The overall accuracy of the best cut-off values was assessed through the calculation of sensitivity, specificity, positive predictive value (PPV), negative predictive value (NPV), and ĸ coefficient. This showed that the best sweat conductivity cut-off value that could predict a positive CF diagnosis was ≥80 mmol/l with 100 per cent sensitivity, 100 per cent specificity with a PPV of 100 per cent, and an NPV of 100 per cent. Likewise, ≤49 mmol/l was the best sweat conductivity cut-off value that could predict a negative CF diagnosis with sensitivity of 100 per cent, specificity of 91.36 per cent, PPV of 78.13 per cent, and NPV of 100 per cent.
Intermediate range sweat conductivity values also showed a good coefficient of correlation (rs 0.62, P<0.003) with intermediate quantitative sweat chloride analysis levels (Fig. 2).
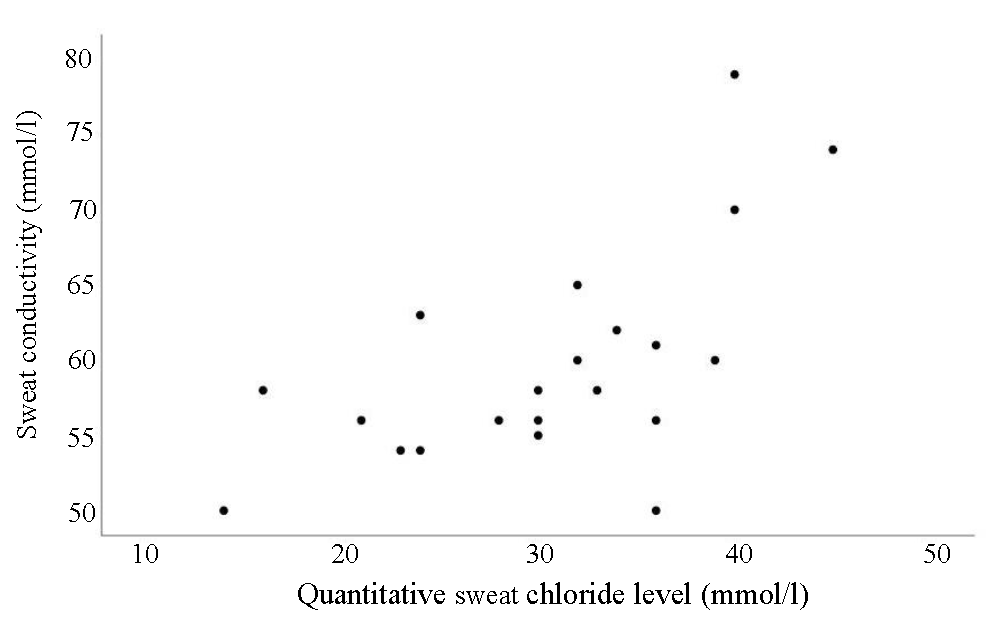
- Correlation of intermediate range sweat conductivity values with intermediate quantitative sweat chloride analysis levels of the cohort.
Discussion
Guidelines by the CLSI and the CFF recommend the collection of sweat following stimulation with pilocarpine iontophoresis in either gauze, filter paper or in coiled collection tubes9,10. Quantitative sweat chloride estimation is the preferred diagnostic test, while the sweat conductivity test is designated as a screening test. Sweat conductivity value exceeding 50 mmol/l should be substantiated through a quantitative sweat chloride analysis12,13.
Ethnic variations in sweat chloride levels have been reported by Borch et al14 Asian ancestry influences all three diagnostic aspects of Cystic Fibrosis. The impact is observed in the phenotype, with a higher prevalence of pancreatic sufficiency in Asian patients. Additionally, there is a consistently lower mean sweat chloride value among individuals of Asian descent, with many values falling within the non-diagnostic range. The presence of diverse CFTR mutations further complicates CF diagnosis in people of Asian ethnicity, as these variations may not be effectively identified through screening panels. There are fewer studies on variability in sweat chloride values in Indian patients contributing to diagnostic dilemma4,15.
Existing literature shows that sweat conductivity values agree with sweat chloride analysis in people from different ethnicities. Lezana et al8 conducted both tests on >3000 study participants in Mexico with clinical suspicion of CF and demonstrated that the sweat conductivity method using Sweat Chek analyzer (Wescor Inc) could be as reliable as quantitative sweat chloride analysis for diagnosing or ruling out CF. In parallel investigations9,16in Brazil, the sweat conductivity test demonstrated an exceptional discriminatory ability in distinguishing between CF and non-CF individuals. The sweat conductivity test done in other ethnic populations in USA, Turkey, Poland, and Germany exhibited a high level of diagnostic accuracy17-20. Bedran et al21 opined that sweat conductivity testing could be viewed as an alternative diagnostic tool for CF in poor health infrastructure settings, given that their study revealed its excellent reliability in diagnosing CF when performed on newborns and infants younger than three months with positive newborn screening (NBS) . Other authors propose that while sweat conductivity testing is reliable, positive values should undergo confirmation through quantitative sweat chloride estimation or a genotype analysis for results in the borderline range22,23.
While the CFTR genotype predominantly dictates sweat chloride concentration in individuals with CF, non-CFTR modifier genes also play a minor role in this variation24. Additionally, biological factors such as age and potentially sex may influence sweat chloride levels. The influence of the above factors on sweat conductivity also needs to be explored.
Despite the demonstrated correlation with sweat chloride values, limited acceptance of sweat conductivity by international guidelines may primarily stem from its lack of specificity, as conductivity reflects a non-selective measurement of ions. It measures chloride along with other ions in the sweat, and thus conductivity values are always ∼15-20 mmol/l higher than quantitative sweat Cl− measurement10.
Patients with cystic fibrosis may have intermediate sweat chloride values by virtue of preserved CFTR function, especially when they have certain mutations. Borderline values are common in some ethnicities and young individuals. CFF recommends that these individuals undergo repeat testing at a later date and or have CFTR gene sequencing to identify 2 bi-allelic CFTR mutations for confirmation of diagnosis11. A good correlation between intermediate-range sweat chloride (30 to 59 mmol/l) and sweat conductivity values (50 to 79) demonstrated in our study supports the application of the same guideline recommendation when using the sweat conductivity method.
In India, sweat testing by quantitative sweat chloride testing is not without challenges. Table II summarises the advantages and disadvantages of different equipments used for sweat testing. The pictorial representation of the equipment has been shown in the supplementary table.
| Test | Equipment and processing | Expenses | Advantages | Challenges |
|---|---|---|---|---|
| Sweat chloride | Indigenous method (24) | Cost of the equipment |
- Inexpensive method - Has acceptable repeatability and accuracy |
- 100 mg of sweat required - Errors related to technique - Room for subjective errors - Requires absolute precision of manual titration - Need for highly experienced personnel |
| Induction: Pilocarpine iontophoresis | INR 2000 (24 USD) | |||
| Collection: Filter paper | ||||
| Analysis: Manual titration using Schales and Schales method | ||||
| Sweat chloride | Macroduct and chloride analyser Automated system (11,12,23) | Cost of equipment |
- Only 15 μl of sweat required - Sample is analysed without dilution - Easy readout of results |
- Limited availability - Expensive equipment - Maintenance of skills needed |
| Induction: Pilocarpine iontophoresis with 0.5% pilocarpine nitrate gel disc |
Macroduct® Sweat Collection System INR 3,57,000 (4293 USD) |
|||
| Collection: Macroduct® Sweat Collection System (Wescor, Logan. UT) | ||||
| Analysis: 926 Sherwood chloride analyser |
926 Sherwood chloride analyser INR 6,19,000 (7,443 USD) |
|||
| Sweat conductivity | Macroduct and sweat check Automated system (23) | Cost of equipment |
- Only 15 μL of sweat required - Sample is analysed without dilution - Easy readout of results - Relatively less expensive |
- Recommended only as a screening test for CF by the Cystic Fibrosis Foundation, USA |
| Induction: pilocarpine iontophoresis with 0.5% pilocarpine nitrate gel disc |
Macroduct® Sweat Collection System INR 3,57,000 (4293 USD) |
|||
| Collection: Macroduct® Sweat Collection System (Wescor, Logan. UT) | ||||
| Analysis: 3120 SweatChek™ Sweat Analyzer (Wescor, Logan. UT) |
Sweat-ChekTMSweat Analyzer INR 2,58,000 (3,102 USD) |
|||
| Sweat conductivity | Nanoduct (25,26) | Cost of the equipment |
- Point of care bedside testing method - Only 3 μl of sweat required - Sensitive in neonates - Relatively less expensive |
- Only few studies comparing with Sweat Chloride measurement are available |
| Induction (employs inbuild Pilogel Iontophoretic Discs), collection and analysis using Nanoduct® (Wescor, Logan. UT) | INR 5,64,040 (6782 USD) |
Recurring costs for each method are as follows: Indigenous method - INR 25 (0.3 USD), both sweat chloride & sweat conductivity measurement following sweat collection by macroduct system - INR 3,333 (40 US), and Nanoduct - INR 2000 (24 USD).
UT, union territory; INR, Indian rupee; USD, United States dollar
The availability of sweat testing is crucial for diagnosing CF in India. As of December 2023, fewer than 10 centres in India had access to an automated chloride analyser, whereas some centres relied on indigenous method to estimate sweat chloride level (Supplementary Table). Therefore, employing sweat conductivity tests using relatively cheaper equipment can enhance the identification and timely referral of individuals suspected of having CF to specialized centres.
Our study was limited by the relatively small number of study participants; particularly those with a definitive diagnosis of CF. There were only eight study participants below the age of one year and none in the neonatal age group. Also, our results are only applicable to sweat conductivity measurement by Sweat-Chek™ Sweat Analyzer on samples collected using the Macroduct® Sweat Collection System. Further studies are needed using Nanoduct® system (Supplementary Table) to see if similar results are obtained.
To summarise, the sweat conductivity test using Sweat-Chek™ Sweat Analyzer on sweat collected by Macroduct® Sweat Collection System showed exceptional ability to discriminate patients with CF from those without in the Indian subcontinent when quantitative sweat chloride analysis was used as the gold standard test. It also fared well to distinguish those with borderline sweat chloride level from those with normal levels.
Overall, the findings of this study suggest that in resource-poor settings cheaper sweat conductivity equipment could be reliably used wherever the sweat chloride analyser is not available. The results of this study cannot be extrapolated to values obtained via Nanoduct® system until further studies are done. Validation of our results by studies done on younger infants and neonates will be valuable.
Acknowledgment
Authors acknowledge the study participants and their caring families. Authors also acknowledge Dr Sushil Kumar Kabra, Professor, Department of Paediatrics, All India Institute of Medical Sciences, New Delhi, India, for providing the representative images (A-C) for supplementary table in the manuscript.
Financial support & sponsorship
None.
Conflicts of Interest
None.
Use of Artificial Intelligence (AI)-Assisted Technology for manuscript preparation
The authors confirm that there was no use of AI-assisted technology for assisting in the writing of the manuscript and no images were manipulated using AI.
References
- Identification of the cystic fibrosis gene: Genetic analysis. Science. 1989;245:1073-80.
- [CrossRef] [PubMed] [Google Scholar]
- Identification of the cystic fibrosis gene: Cloning and characterization of complementary DNA. Science. 1989;245:1066-73.
- [CrossRef] [PubMed] [Google Scholar]
- Identification of the cystic fibrosis gene: Chromosome walking and jumping. Science. 1989;245:1059-65.
- [CrossRef] [PubMed] [Google Scholar]
- Phenotype-genotype data from a cohort of 120 patients with cystic fibrosis followed at a tertiary referral hospital in South India. Available from: https://papers.ssrn.com/abstract=4558634, accessed on August 28, 2024.
- [Google Scholar]
- Heat prostration in fibrocystic disease of the pancreas and other conditions. Pediatrics1951. ;8:648-56.
- [CrossRef] [Google Scholar]
- Abnormal electrolyte composition of sweat in cystic fibrosis of the pancreas. Pediatrics. 1953;12:549-63.
- [PubMed] [Google Scholar]
- A test for concentration of electrolytes in sweat in cystic fibrosis of the pancreas utilizing pilocarpine by iontophoresis. Pediatrics. 1959;23:545-9.
- [CrossRef] [PubMed] [Google Scholar]
- Sweat conductivity and chloride titration for cystic fibrosis diagnosis in 3834 subjects. J Cyst Fibros. 2003;2:1-7.
- [CrossRef] [PubMed] [Google Scholar]
- Sweat conductivity: An accurate diagnostic test for cystic fibrosis? J Cyst Fibros. 2014;13:528-33.
- [CrossRef] [PubMed] [Google Scholar]
- Sweat testing and recent advances. Front Pediatr. 2021;9:649904.
- [CrossRef] [PubMed] [PubMed Central] [Google Scholar]
- Diagnosis of cystic fibrosis: Consensus guidelines from the cystic fibrosis foundation. J Pediatr. 2017;181S:S4-S15.e1.
- [CrossRef] [PubMed] [Google Scholar]
- CLSI C34: Sweat sample collection & quantitative chloride analysis. Available from: https://clsi.org/shop/standards/c34/, accessed on October 16, 2024.
- CF diagnosis clinical care guidelines. Available from: https://www.cff.org/medical-professionals/cf-diagnosis-clinical-care-guidelines, accessed on October 16, 2024.
- Ethnicity impacts the cystic fibrosis diagnosis: A note of caution. J Cyst Fibros. 2017;16:488-91.
- [CrossRef] [PubMed] [Google Scholar]
- Pseudo-bartter syndrome and intermediate sweat chloride levels-it could still be cystic fibrosis! Indian J Pediatr. 2021;88:600.
- [CrossRef] [PubMed] [Google Scholar]
- Comparison between classic Gibson and Cooke technique and sweat conductivity test in patients with and without cystic fibrosis. J Pediatr (Rio J). 2010;86:109-14.
- [CrossRef] [PubMed] [Google Scholar]
- Clinical evaluation of the macroduct sweat collection system and conductivity analyzer in the diagnosis of cystic fibrosis. J Pediatr. 1994;124:255-60.
- [CrossRef] [PubMed] [Google Scholar]
- Sweat conductivity test: Can it replace chloride titration for cystic fibrosis diagnosis? Turk J Pediatr. 2012;54:576-82.
- [PubMed] [Google Scholar]
- Przydatność konduktometrycznego testu potowego w diagnostyce mukowiscydozy [The usefulness of the conduction sweat test in diagnosis of cystic fibrosis] Pediatr Pol. 1995;70:639-43.
- [PubMed] [Google Scholar]
- Vergleich zwischen klassischer Gibson-Cooke-Methode und Chlorid-sensitiver Elektrode zur Schweisstestung bei der Diagnose der zystischen Fibrose [Comparison of the classical Gibson-Cooke methods and the chloride-sensitive electrode in sweat testing for diagnosis of cystic fibrosis] Padiatr Padol. 1991;26:173-5.
- [PubMed] [Google Scholar]
- Sweat conductivity for diagnosing cystic fibrosis after positive newborn screening: Prospective, diagnostic test accuracy study. Arch Dis Child. 2023;108:538-42.
- [CrossRef] [PubMed] [Google Scholar]
- Sweat testing: Can the conductivity analysis take the place of the classic Gibson and Cooke technique? J Pediatr (Rio J). 2010;86:89-91.
- [CrossRef] [PubMed] [Google Scholar]
- Sweat conductivity for the diagnosis of cystic fibrosis. J Cyst Fibros. 2004;3:205.
- [CrossRef] [PubMed] [Google Scholar]
- Sources of variation in sweat chloride measurements in cystic fibrosis. Am J Respir Crit Care Med. 2016;194:1375-82.
- [CrossRef] [PubMed] [PubMed Central] [Google Scholar]


