
Translate this page into:
Immunological memory in infected & exposure näive individuals one year post SARS-CoV-2 vaccination
For correspondence: Dr Anita Desai, Department of Neurovirology, National Institute of Mental Health and Neurosciences (NIMHANS), Bengaluru 560 029, Karnataka, India e-mail: anitasdesai@gmail.com
-
Received: ,
Accepted: ,
Abstract
Background & objectives
COVID-19 has affected millions and wreaked havoc on global healthcare systems as well as a devastating impact on the economies of various nations. Vaccines are highly pivotal in promoting an appropriate immune response. Understanding the effectiveness and stability of the vaccines is essential as these may differ across populations. Hence, this study explored the durability and efficacy of the COVISHIELD (ChAdOx1 nCoV-A) vaccine among healthcare workers (HCWs).
Methods
In this study, 84 HCWs who received two doses of COVISHIELD and had no breakthrough infections or precautionary doses were assessed. Participants were categorised into four groups (A, B, C, and D) based on pre-immunisation antibody status and SARS-CoV-2 RT-PCR results. Group A had prior infection and IgG antibodies, group B had RT-PCR positivity without detectable antibodies, group C had IgG antibodies without RT-PCR testing, and group D was exposure-näive. Humoral immunity was assessed by measuring IgG antibodies to the spike protein, while cell-mediated immunity was evaluated through SARS-CoV-2-specific T-cell markers and immunophenotyping.
Results
Over one year, a significant decrease in anti-spike IgG levels was observed in all groups (P<0.0001). It was observed that memory B cells declined significantly among all the groups over a period of one year [group A (P<0.0001), group B (P=0.0080), group C (P=0.0158), and group D (P=0.0004)]; no significant decrease inactivated T-cells was observed over a year. The mean of anti-spike IgG levels in samples from exposed participants (group A, B, C) versus non-exposed (group D) was significantly higher (P<0.0001).
Interpretation & conclusions
These findings indicate the need for regular booster doses of vaccination due to the waning of immunity by the vaccine. We also demonstrate that hybrid immunity (a combination of immune response post-natural infection and vaccination) provides better protection than vaccination alone.
Keywords
Cell-mediated immunity
COVID-19
COVISHIELD vaccine
humoral immunity

The advancement of the COVID-19 pandemic has been a complex and dynamic process, marked by phases of rapid spread, containment efforts, scientific advancements, and challenges. The pandemic originated in December 2019 when cases of pneumonia-like respiratory illness were reported in Wuhan, Hubei province of China. The aetiological virus was identified as a novel coronavirus, initially named 2019-nCoV renamed later as SARS-CoV-2. The virus swiftly transcended borders swiftly, evolving into a global health emergency, as declared by the World Health Organization (WHO)1.
The battle between the immune system and the SARS-CoV-2 virus is a nuanced interplay of two fundamental defence strategies: (i) the innate response, a rapid but generalised reaction, and (ii) the adaptive response, a highly specific and memory-driven countermeasure. This dual approach forms the cornerstone of our immune defence against the coronavirus2. The immune response to SARS-CoV-2 is intricately woven with the production of antibodies. These specialised proteins, generated by B-cells, act as sentinels, targeting viral components and neutralising their infectivity. For example, SARS-CoV-2 spike antibodies recognise the virus’s spike protein, block its entry into host T-cells, and prevent infection. Cell-mediated immunity orchestrated by T-cells complements the humoral response. To prevent viral replication and dissemination and to promote the formation of memory, virus-specific CD4+ and CD8+ T-lymphocytes that recognise immunodominant epitopes from the S protein are essential3,4. Helper CD4+ T-cells foster antibody production by activating B-cells, whereas cytotoxic CD8+ T-cells recognise and eliminate virus-infected cells. Memory B and T-cells, etched with the virus’s blueprint, stand guard long after the infection subsides. Neutralising antibodies generated by memory B-cells hinder the binding of the viral spike protein to the angiotensin-converting enzyme 2 (ACE-2) receptor5. This immunological memory empowers the body to mount a rapid and potent response upon re-encounter with the virus, underpinning the development of immunity, the longevity of protection, and potential immunity against reinfection.
The rapid evolution and implementation of COVID-19 vaccines had been a ground-breaking achievement in combating the pandemic, and which were distributed with unrivalled speed. Emergency use authorisations played a substantial role in expediting the availability of vaccines, allowing governments and healthcare systems to begin mass vaccination campaigns as soon as safe and effective vaccines become available. Protective immunity by vaccination is mediated by both humoral and cell-mediated immunity6.
Early clinical investigations of the vaccines’ immunogenicity had few published data in terms of the total number of examined participants and the evaluated parameters4. Most studies published data on virus-binding antibodies7-9, while only a few did it for T-cell immunity10-12. Shortly after the final vaccination, antibody and T-cell responses were recorded for a limited period.
Although our grasp of SARS-CoV-2 transmissibility and immunological interactions has improved significantly, doubts remain about the durability and robustness of vaccine-induced immunity, especially in a real-world context. COVISHIELD was the first vaccine in India, made available for large-scale use. It was initially rolled out on January 16, 2021 among HCWs13. Studies have evaluated vaccine efficacy, safety, and immunogenicity for COVISHIELD14,15. However, there is limited data on the longitudinal impact of observed immunity on the effectiveness and duration of immunity, as well as immune interactions across time.
This study aimed to examine the immune responses elicited by the COVISHIELD vaccine, shedding light on the interplay between humoral and cellular immunity and their implications for effectiveness over a longer duration post-vaccination. Further, the intersection of vaccination and prior infection endorses the concept of hybrid immunity that leads to higher levels of antibodies and robust T-cell responses than vaccine-generated immunity alone, offering a layered defence against reinfection and variants. This knowledge is key to the improvement of immunisation plans, especially in situations where maintenance of immunity may require periodic doses of boosters.
Materials & Methods
The study was conducted on HCWs in service at the National Institute of Mental Health and Neurosciences (NIMHANS), a tertiary care hospital in Bengaluru. The study protocol was approved by the Institutional Ethics Committee and a written informed consent was obtained from all the participants submitting blood samples for the study, prior to its commencement.
Study participants
Participants of both genders, aged between 19 and 64 yr, willing to participate in the study, were administered two doses of the COVISHIELD vaccine and requested to submit blood samples at three-time points (21 days, 6 and 11 months) post the second dose. The sample size was calculated using G*Power 3.1.9.2 software (Heinrich-Heine-Universität Düsseldorf HHU, Düsseldorf, Germany), based on the comparison of anti-SARS-CoV-2 IgG antibodies from a sero-survey.
Following written informed consent, a total of 204 volunteers submitted blood samples for the originally planned longitudinal study. However, as the study progressed, some participants experienced breakthrough (43/204) or silent infection (35/204), while a few participants received precautionary doses (42/204) before submission of the third sample required for the study. Hence, we present the analysis of the immune response data obtained from the remaining (84/204) participants (Supplementary Fig. 1).
Sample collection & storage
The blood sample collection period was from March 2021 to May 2022. Blood samples were collected from participants by standard venipuncture at three time points in two tubes (3 ml in SST and 6 ml in BD K2 EDTA vacutainer tubes). Peripheral blood mononuclear cells (PBMCs) were separated using standard protocol using Ficoll- histopaque.
Grouping of participants
The participants were divided into four groups- A, B, C, and D based on the results of the sero-survey conducted on HCWs in the department of neurovirology of the tertiary care hospital just before the introduction of the vaccine (unpublished data) and evidence of SARS-CoV-2 Real-Time Reverse-Transcriptase Polymerase Chain Reaction (RT-PCR)results prior to vaccination. Group A participants were positive for both RT-PCR and anti-SARS-CoV-2 IgG antibodies; group B were RT-PCR positive but showed no identifiable anti-SARS-CoV-2 IgG antibodies; group C participants were never tested by RT-PCR but had detectable anti-SARS-CoV-2 IgG antibodies; group D participants were never tested by RT-PCR and had no detectable anti-SARS-CoV-2 IgG antibodies before immunisation. Therefore, participants grouped into A, B, and C were considered as those exposed to SARS CoV-2, whereas those in group D were exposure näive (Table I).
| Groups | COVID-19 RT-PCR status*/SARS-CoV-2 antibody status** (pre-vaccination) | 21 days | 6 months | 11 months* |
|---|---|---|---|---|
| A | RT PCR positive/Antibody positive | 57 | 52 | 50 |
| B | RT PCR positive/Antibody negative | 55 | 51 | 49 |
| C | No symptoms, RT PCR not done/Antibody positive | 54 | 51 | 51 |
| D | No symptoms, RT PCR not done/Antibody negative | 59 | 55 | 54 |
| Total | 225 | 209 | 204 | |
| Dropouts |
21 days to 6 months-7.11% 6 months to 11 months-2.39% Total dropouts-9.3% |
|||
Assessment of humoral immune response
A commercial quantitative assay, `Elecsys® Anti-SARS-CoV-2 (Roche Diagnostics, Mannheim, Germany) sandwich assay was used to estimate the anti-spike (S) IgG antibody titre to SARS-CoV-2 as per the manufacturer’s instructions. A cut-off index ≥0.8 U/ml - ≤250 U/ml was considered as positive. Any sample with a value >250 U/ml was diluted using a universal diluent (Roche Diagnostics, Mannheim, Germany) and re-tested16. The final value was calculated based on the dilution factor.
A commercial qualitative Elecsys Anti-SARS-CoV-2 (Roche Diagnostics, Mannheim, Germany) sandwich assay, where a recombinant protein i.e. nucleocapsid (N) antigen is used to identify antibodies to N protein against SARS-CoV-2. Cut-off index ≥1was considered as reactive17.
Elecsys CLIA (Chemiluminescent assay, Roche Diagnostics, Mannheim, Germany) is a commercially available kit that was used to detect IgG and N antibodies against the spike S and nucleocapsid N, respectively. Though this kit has not been exclusively validated by ICMR, the same kit has been used in other reported studies citing high accuracy18-22. Further, the kit is FDA approved under emergency use authorisation.
Assessment of cell-mediated immune response
Commercially available synthetic membrane-bottomed 96-well plates pre-coated with an IFN-γ specific antibody (capture antibody) were used to perform ELISpot assay (MabTech, USA) as per the manufacturer’s protocol. A polyclonal activator for human T-cells (crosslinking antibody mAb CD3-2) was supplied in a kit as a positive control for cytokine secretion and was used to assess the run quality. In brief, PBMCs (approximately 2.5 x 10⁵ cells) were incubated with the commercially available SARS-CoV-2 peptide pool derived from the Wuhan sequence (JPT (PepmixTM; MabTech, USA) for 18-24 h (Supplementary Table). Following incubation, the wells were washed with 1X PBS and labelled with biotinylated detection antibody. Streptavidin conjugated with alkaline phosphatase was added and kept at room temperature until the spots became visible. Rinsing under running tap water stopped colour development. After drying, the plates were read with an AID ELISpot reader version 7.0. The spots counted were expressed as spot-forming units (SFU)/2.5 x 105 cells. The cut-off was calculated as Mean+2 Standard deviation of unstimulated sample. Samples showing Spot forming units (SFU) (T-cells production of IFN-γ) >cut-off were considered positive.
Multi-parametric flow cytometry (10,000 events/sample) was adopted to assess the samples collected at 21 days, 6 months, and 11 months after staining with appropriate fluorescent monoclonal antibodies to evaluate T-cell and B-cell subsets, as per the Human Immunology Project Consortium (HIPC) guidelines23,24 and a previously published study25. Since different T-cells express multiple markers, it is essential to sequentially subtype the cells, necessitating multiple antibodies as a cocktail. In brief, PBMCs were thawed in 4-5 ml of RPMI-10 per cent Fetal Bovine Serum (FBS) and were incubated for 3 h at 37°C. The cells were pelleted and re-suspended in 1ml RPMI-10 per cent FBS. Cells were counted. Approximately 106 cells were stimulated with a SARS-CoV-2 spike-specific peptide pool (JPT PepmixTM; MabTech, USA). The SARS-CoV-2 S1 scanning pool contained 166 peptides from the human SARS-CoV-2 virus at a final concentration of 1µg/ml. Following stimulation, the cells were split into two vials, one each to stain for T- and B-cell subsets. The cells were washed and labelled with an antibody cocktail as appropriate. Stained cells were then analysed in the flow cytometer (BD, FACSVerse) and by FlowJo (v10.8; Treestar; USA)26.
The activated T-cell subsets (helper and memory subsets) were identified using a cocktail of fluorescently labelled monoclonal antibodies to CD3, CD4, CD8, CXCR3, CCR6, CD69, and CD137. The B-cells were subtyped using a cocktail of fluorescently labelled monoclonal antibodies to CD3, CD19, and CD27 (Table II). Unstimulated, stained samples provided the baseline, while unstimulated, unstained samples served as negative controls for flow cytometry gating and background correction. Minimal responses observed in unstimulated populations, as expected, reflect the absence of immune activation triggers.
| Sl. No. | Cell subset | Antibody | Monoclonal clone | Fluorescent label |
|---|---|---|---|---|
| 1 | Pan T-cells | CD3 | UCHT1 | V450 |
| 2 | T helper cells | CD4 | SK3 | PerCp-Cy 5.5 |
| 3 | T cytotoxic cells | CD8 | SK1 | APC H7 |
| 4 | Differentiating between Th1, Th2 and Th17 | CCR6 | 11A9 | PE-Cy7 |
| CXCR3 | 1C6 | PE | ||
| 5 | T cell activation markers | CD69 | FN50 | APC |
| CD137 | PO3 | V500/BV510 | ||
| 6 | Pan B-cell marker | CD19 | SJ25C1 | PerCp-Cy 5.5 |
| 7 | B memory cells | CD27 | M-T271 | PE-Cy7 |
Antibody source: BD Bioscience, New Jersey, USA
Gating strategy for estimating frequency of activated memory T and memory B-cells
We defined the T-cells within the viable lymphocyte population as CD3+.Based on earlier published data, CD137+ and CD69+ surface markers were used to identify activated memory T-cells (CD3+CD137+CD69+)25. This population was further gated to define the CD4+ and CD8+ T-cell subsets. Utilising CXCR3 and CCR6 surface markers (Supplementary Fig. 2), the CD4+ cells were sub-typed into Th1 (CXCR3+CCR6-), Th2 (CXCR3-CCR6-), and Th17 (CXCR3-CCR6+). CD3-CD19+ lymphocytes had been defined as B-cells. Subsequently, surface markers CD27- (näive B-cells) and CD27+ (Memory B-cells) classification was carried out (Supplementary Fig. 3) as per HIPC guidelines23,24.
Statistical analysis
The analysis was performed using GraphPad Prism version 8.4.2 (679). The distribution of continuous scale data was presented as mean ± standard deviation. Frequency distributions were presented as percentage. All the continuous scale data were evaluated for normality distribution and goodness of fit using the Shapiro-Wilk test. Kruskal Wallis was performed to enumerate the statistical difference in antibody quantity across the groups. Repeated measures of ANOVA were used to report the statistical significance of the antibody development trend. Repeated measure analysis/Friedman test was used to compare the values across the time points. The results were considered statistically significant if P (α) <0.05.
Results
Demography of participants
Initially, 225 participants comprising of HCWs from NIMHANS were enrolled in the study at 21 days post the second dose of the COVISHIELD vaccine. However, some of the participants (21/225) dropped out at different times during the study. Therefore, the study population comprised 204 participants. Further, the data obtained from only 84/204 was analysed as the remaining 120/204 participants either experienced breakthrough infections, were silently exposed during the study, or received a precaution dose before submitting the third sample at the defined time point. Among the 84 participants, 32.14 per cent (27/84) were identified with co-morbidities, most commonly hypertension 16.66 per cent (14/84), followed by diabetes mellitus 4.76 per cent (4/84), both DM & HTM 4.76 per cent (4/84), and other conditions 5.95 per cent (5/84). Therapeutic immunosuppressive drugs, such as steroids and anticancer drugs, were used by one individual (1.19%) out of 84 participants. A total of 67 per cent (56/84) of participants did not report any history of co-morbidities (Table III).
|
Groups (n=84) |
No. of participants enrolled |
Age distribution in years Mean, SD (range) |
Gender distribution | No. of HCWs with Co-morbidities | Immunosuppressive drugs | ||||
|---|---|---|---|---|---|---|---|---|---|
| Male (%) | Female (%) | DM | HTN | DM and HTN | Others | ||||
| Group A | 19 | 47.53, 14.02 (19-64) | 12 (27.27) | 7 (17.5) | 2 | 2 | 3 | 1 | 0 |
| Group B | 21 | 35.33, 6.81 (27-50) | 8 (18.18) | 13 (32.5) | 1 | 4 | 0 | 2 | 0 |
| Group C | 26 | 38.65, 7.56 (31-59) | 13 (29.54) | 13 (32.5) | 0 | 4 | 1 | 1 | 0 |
| Group D | 18 | 40.28, 14.28 (19-65) | 11 (25) | 7 (17.5) | 1 | 4 | 0 | 1 | 1 |
| Total | 84 | - | 44 (52.38) | 40 (47.61) | 4 | 14 | 4 | 5 | 1 |
| P values of the parameters in comparison with the groups | 0.0220 | 0.3601 | 0.4942 | 0.2944 | |||||
DM, diabetes mellitus; HTN, hypertension; Others, rheumatoid arthritis, lupus, hypothyroidism, chronic allergy
Estimation of humoral immune response
Detection of IgG antibody to S protein
The mean comparison of levels of anti-spike IgG antibodies were observed to decrease significantly from 21 days to 6 months, followed by a further gradual decline at 11 months in the vaccinated participants (P<0.0001) (Fig. 1A and B). The mean of anti-spike IgG levels in samples from exposed participants (group A, B, C) versus non-exposed (group D) was significantly higher at 21 days (P<0.0001), 6 months (P<0.0001), and 11 months (P<0.0001).
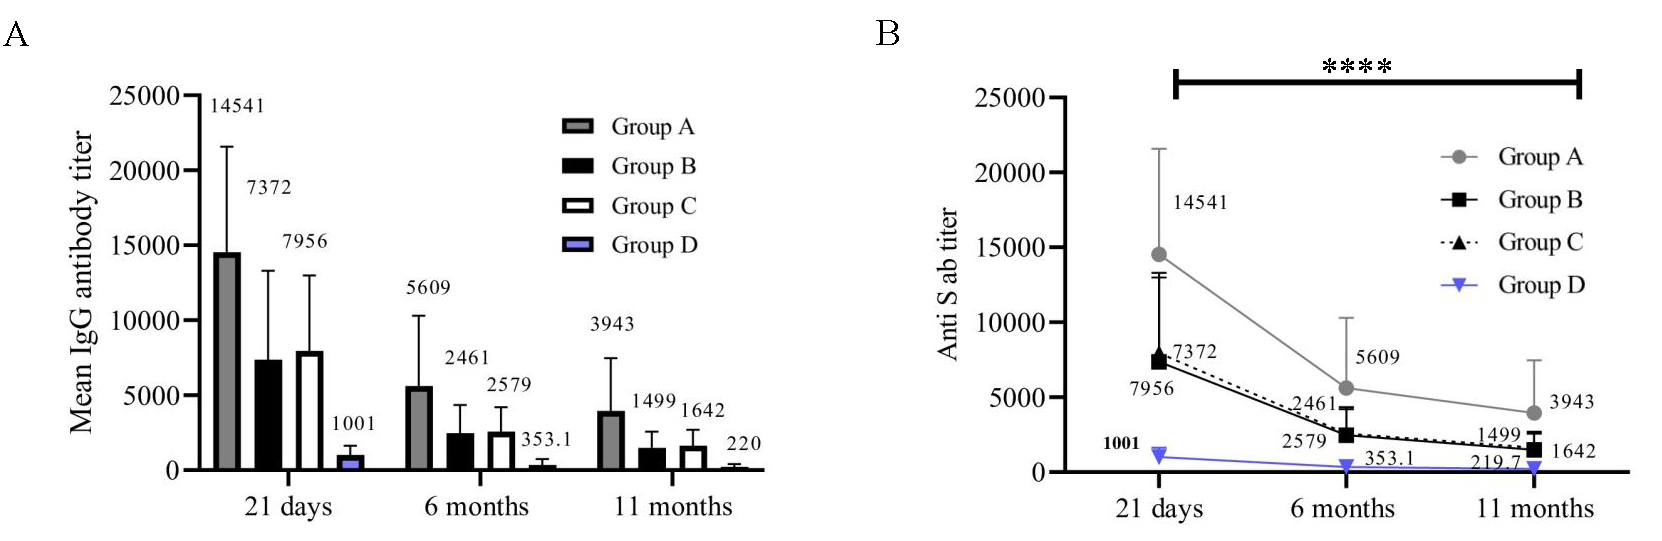
- Anti-S antibody titre (CLIA Units). The X-axis represents three time points (21 days, 6 months, and 11 months). Y-axis represents the S antibody titre in CLIA units. (A) Anti-spike IgG antibody levels at three time points (n=84). (B) Anti-spike IgG antibodies in individual groups(n=84).
Detection of IgG antibodies to N protein
Participants belonging to group A, B, and C had experienced an infection or silent exposure to the virus before vaccination. We therefore estimated the presence of anti-N antibodies in all participants (Fig. 2A and B). As expected, group A (P=0.0001) and group C (P=0.0009) exhibited a gradual drop in anti-N antibody levels over time. A robust anti-N antibody response was not noticed in participants from group B at any time point (Fig. 2B). Further, no anti-N antibodies were detected in participants belonging to group D.
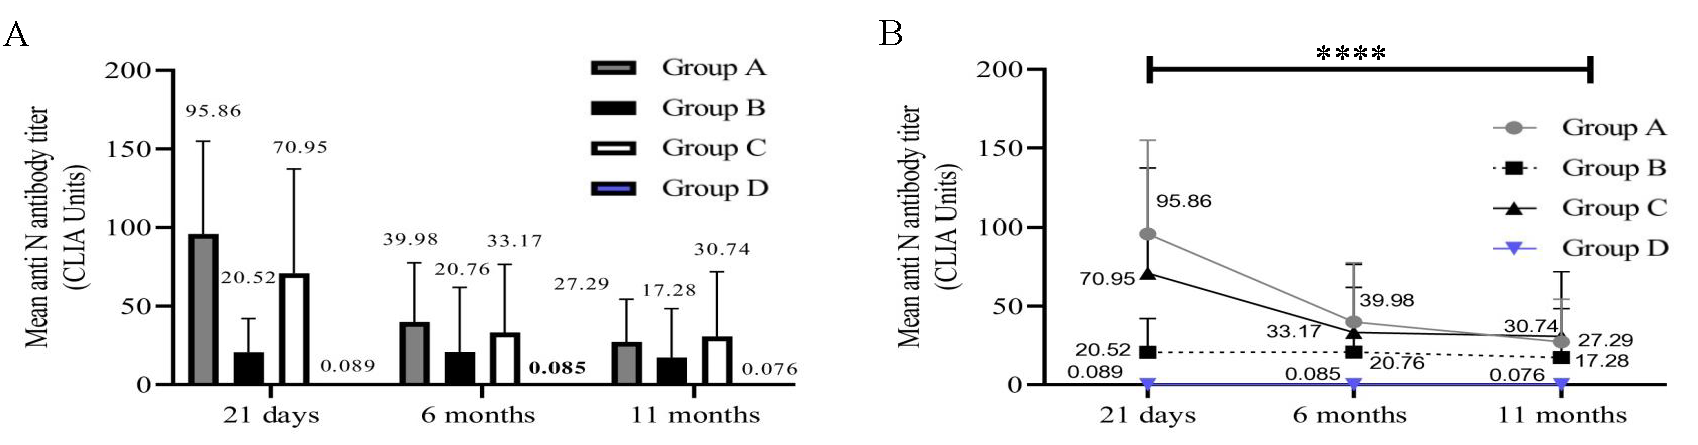
- Anti-N antibody titre (CLIA Units). The X-axis represents three time points (21 days, 6, and 11 months). Y-axis represents the N antibody titre in CLIA units. (A) Anti-N antibody levels in 4 groups at 3 time points (n=84). (B) Anti-N antibody in individual groups (n=84).
Spearman’s correlation between Anti-S and Anti-N antibody
The Spearman’s Correlation revealed a significant positive correlation (P<0.0001) between anti-S and anti-N antibody levels at 21 days (r=0.6812), 6 (r=0.7703), and 11 months (r=0.7607).
Cell-mediated immune response
Enumerating functional IFN-γ T-cells by ELISpot assay
The ELISpot assay was performed on samples collected at 21 days, 6, and 11 months post-vaccination. A reduction in the number of SFUs and in the percentage of participants with positive results was observed across the groups from 21 days to 11 months (Fig. 3A and B). For statistical analysis, the samples that did not yield results due to loss of cell viability were not included. Therefore, the analysis was restricted to 46 out of the 84 samples. The number of participants with T-cells producing IFN-γ following stimulation was significantly higher in groups A, B, and C compared to D at 21 days (P=0.0299) and 6 months (P=0.0398) but not at 11 months (P=0.9232).
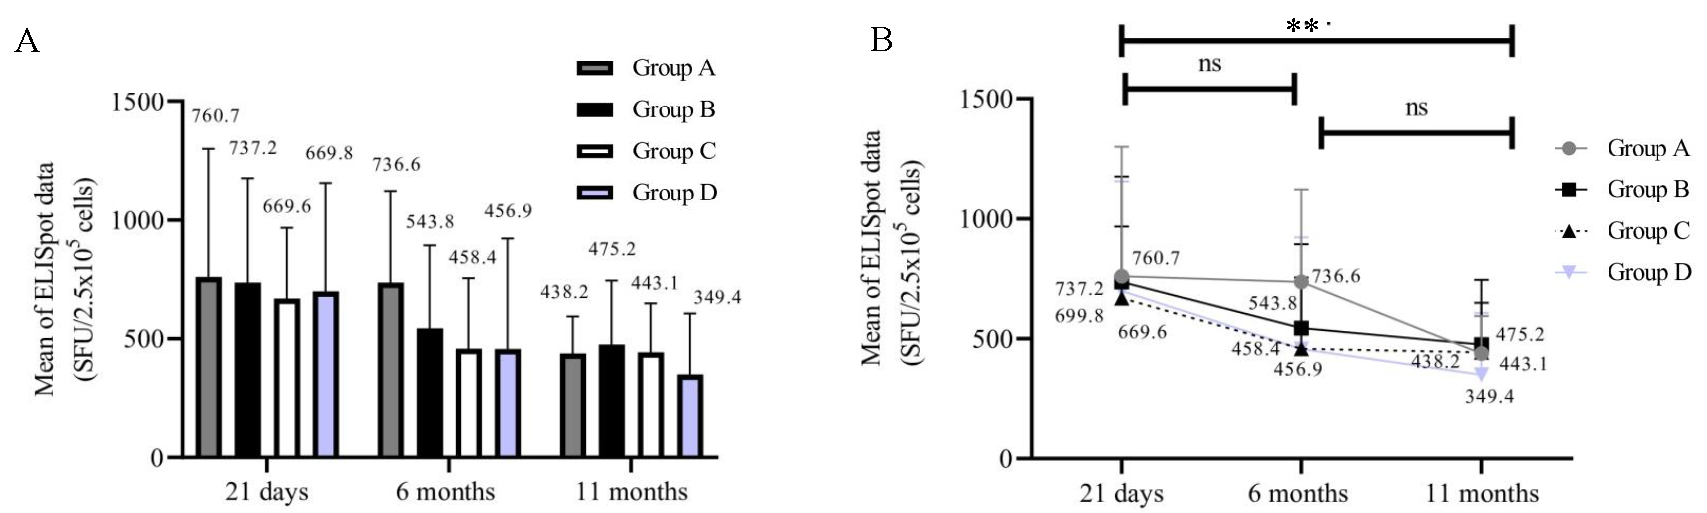
- ELISpot (SFU/2.5 X 105). The X-axis represents three time points (21 days, 6 months, and 11 months). Y-axis represents the ELISpot data in (SFU/2.5 X 105). (A) T-cells producing IFN-γ in groups at 3 time points (n=46). (B) ELISpot data in individual group of participants (n=46).
Significance of activated T-cells and memory B-cells
Percentages of activated T-cells (54/84) in all the groups at 21 days, 6 months, and 11 months were calculated. We could analyse only 54 samples since the samples that did not yield results due to a loss of cell viability were not included for analysis. Individual groups [group A (P=0.5247); group B (P=0.2182); group C (P=0.4173); and group D (P=0.0435)] showed no significant decrease inactivated T-cells (Fig. 4A and B). On the other hand, the percentage of memory B-cells in all groups at 21 days, 6 months, and 11 months (54/84) significantly decreased over time (Fig. 5A and B). Group A (P<0.0001), group B (P=0.0080), group C (P=0.0158), and group D (P=0.0004). Immunophenotyping results indicated a gradual decrease in B-cells and these results correlated with those of the antibody levels.
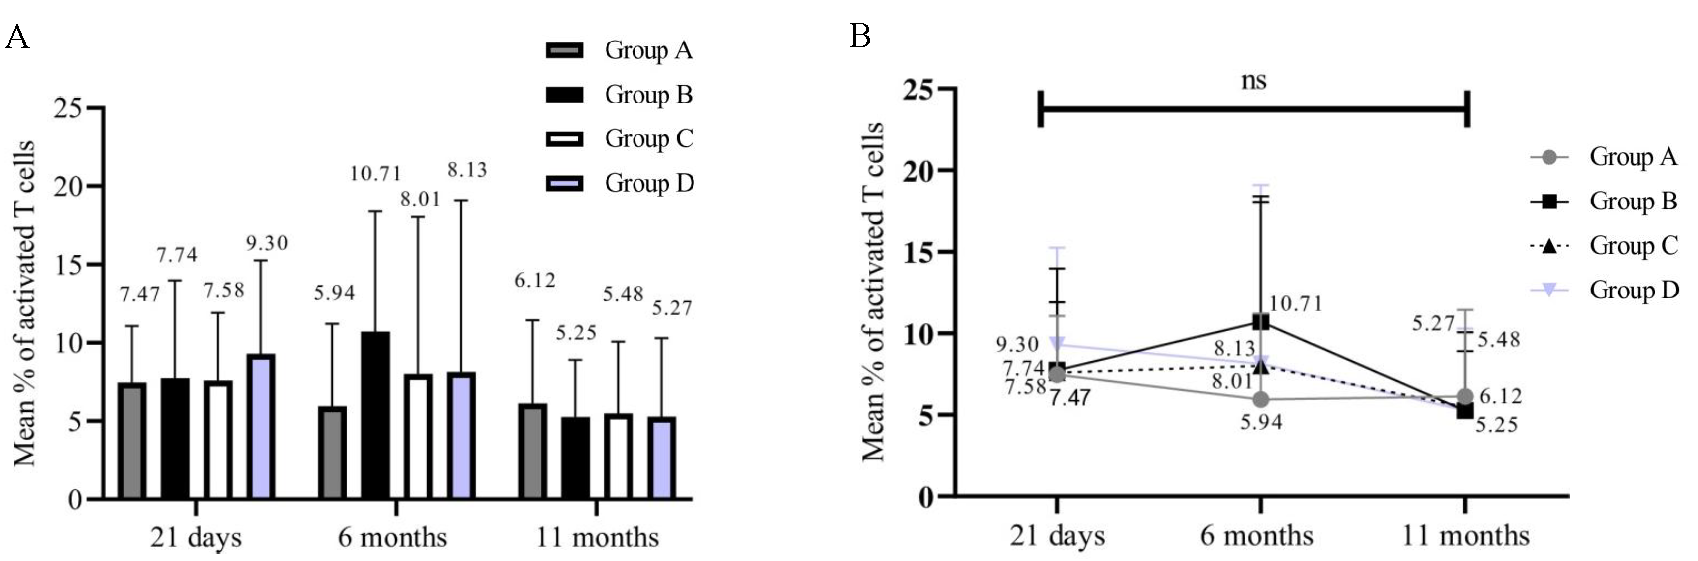
- Frequency of T cell activation following stimulation in all groups at multiple time points. The X-axis represents three time points (21 days, 6, and 11 months). Y-axis represents the frequency of activated T-cells data. (A) Frequency of activated T-cells in all groups (n=54), (B) Significance of activated T-cells findings in individual groups (n=54).
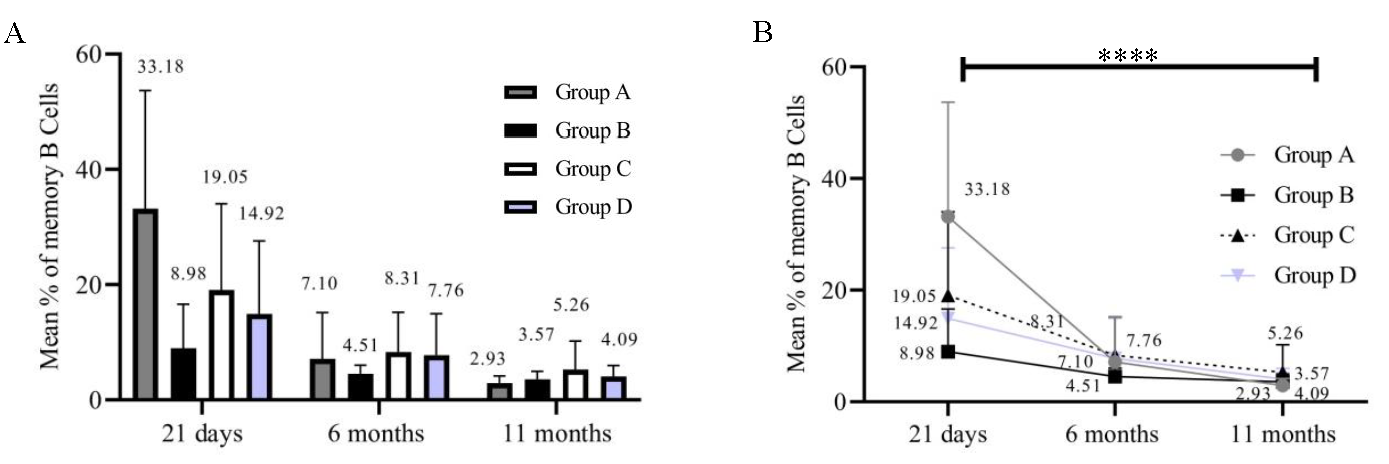
- Frequency of memory B-cells. The X-axis represents three time points (21 days, 6 months, and 11 months). Y-axis represents the frequency of memory B-cells. (A) frequency of Memory B-cells in all groups (n=54). (B) Significance of memory B-cell findings (n=54).
Discussion
This study measured the durability, efficacy and effectiveness of the COVISHIELD vaccine administered to HCWs and compared the immune response profile between those infected/exposed before vaccination (hybrid) to those not exposed (vaccine only). The study enrolled 225 HCWs, of whom 204 completed the study, yielding a final analysis cohort of 84 participants. However, 120 participants out of 204 were excluded from the analysis due to factors like a breakthrough, silent exposure to the virus, or vaccine default due to a third dose. The cohort showed diverse age distribution, co-morbidities (32.14%), predominantly hypertension and diabetes, and 1.19 per cent immunosuppressive drug users, indicating a healthy cohort that may influence the immune response outcomes.
We observed an abrupt decrease (64%) in anti-spike IgG antibody titre levels between 21 days to 6 months and a gradual drop (33%) from 6 to 11 months post-vaccination. This decline underscores the need for ongoing monitoring of vaccine-induced immunity, particularly as the population ages and new variants emerge. Similarly, significant waning of antibodies had been demonstrated by other studies. Furthermore, these longitudinal vaccine studies demonstrated 56 to 72 per cent decline in antibody levels within 6 months13,27. Such reduction could be the reason for the short lifespan of antibody-producing plasma cells and the loss of memory B-cells that leads to diminished immune strength28.
Interestingly, participants with prior exposure to the virus (groups A, B, and C) exhibited significantly increased levels of anti-spike IgG antibodies as compared to the non-exposed group (group D) at all time points assessed. This reinforces the concept that previous infection can enhance vaccine-induced immunity, a finding that aligns with other studies indicating that hybrid immunity (prior infection followed by vaccination) tends to elicit stronger immune responses than vaccination alone29.
The study reported that group A (RT-PCR positive) experienced robust humoral immunity (Fig. 2B) post-vaccination compared to those in group C (asymptomatic/silent exposure) not seeking RT-PCR test. Pre-existing immunity to the chimpanzee adenovirus used in the vaccine may dampen immunological responses in asymptomatic individuals30,31. Alternatively, Holder et al31 demonstrated that the humoral responses to SARS-CoV-2 mRNA vaccines were enhanced in individuals with moderate to severe symptoms, emphasising the role of infection severity in immune response patterns32.
Nantel et al33 highlighted that immune protection depends on the infection symptoms and their serostatus during vaccination. Asymptomatic individuals showed lower responses akin to individuals without prior exposure. Therefore, the study suggested that administering a two-dosage primary vaccination regimen and subsequent booster shots to previously infected but asymptomatic individuals would be beneficial to elicit robust immunity33. Yet another study observed that the asymptomatic individuals exhibited a minimal number of virus particles in their nasopharynx as assessed by RT-PCR34. This is likely due to either the absence of or impaired viral replication, leading to weak or possibly non-existent antibody response35.
The presence of anti-N antibodies in groups with prior infection (A, B, C) and their decline over time suggested that while the body mounts an initial robust immune response, the durability of this response may be compromised, particularly in those without subsequent exposures. The vaccine-specific immunity was demonstrated by the persistent lack of anti-N antibodies among the uninfected participants in group D. Limited humoral responses were observed in group B (symptomatic, RT-PCR positive) due to delayed antibody generation that remained unidentifiable during the sero-survey testing. These individuals may eventually develop antibodies, but these antibodies tend to diminish within 2 to 3 months. A case study showed that symptomatic individuals did not produce IgG or IgM antibodies due to delayed antibody production36.
A synergistic relationship is thus highlighted by the positive association between anti-S and anti-N antibody levels at different time points, suggesting that strong antibody responses reflect immunological competence after vaccination. Tracking both indicators may provide a good evaluation of the state of immunology post-immunisation. Similar correlation of anti-S and anti-N (r=0.405, P<0.001) antibody titre was observed by Lee and colleagues among HCWs receiving third dose of COVISHIELD37.
When compared to reactions brought on by natural infection, vaccination-induced T-cell responses exhibit corresponding capabilities, which is primarily indicated by the production of IFN-γ. A reduction in a number of spot-forming units (SFUs) and percentages of participants with positive results were observed across the groups from 21 days to 11 months (P=0.0051). Decreased IFN-γ production correlated with the low antibody levels at 11 months38.The number of participants with T-cells producing IFN-γ following stimulation was higher in groups A, B, and C compared to D in samples collected at 21 days and 6 months. A similar observation was also reported by Sedegah et al39. Interferon responses to spike protein were substantially broader and higher in those previously infected and vaccinated (100 per cent) compared to those vaccinated but with no prior exposure (89%).
Although ELISPOT assay used in this study provides some clarity on the T-cells producing IFN-γ post-stimulation with SARS-CoV-2 spike peptides, the type and subtypes of the source cells were not defined. Additional immune-phenotyping was performed to study SARS-CoV-2 specific T- and B-cell subsets. Both ELISpot and T cell immune-phenotyping data together suggest a marginal decline in cellular immunity, indicating that cell-mediated immunity lasts for a longer period. In contrast, we observed that the frequency of B memory cells, reduced over the study period in all groups. This finding suggests that the memory B-cell compartment may be integral to maintaining antibody levels and that a decrease in memory B-cells could be a contributing factor to the observed decline in humoral immunity. This is in agreement with other studies reporting declined antibody levels and B-cells over time, whereas T-cell immune responses showed much better sustainability27,40,41. Furthermore, Rodda et al40 and Hurme et al41 demonstrated that T-cell response directed against spike protein sustains for a longer period of time in both the vaccine-elicited and infection-generated immunity40,41. Dan et al25 observed the waning of B-cell-generated antibodies within 6 to 8 months25.
This study did have certain limitations. Few but highly immunogenic peptides (currently available commercially) for stimulation of cells to study cell-mediated immune response would have probably been more appropriate. Cell viability of some samples collected at 21 days was compromised for T- and B-cell analysis due to long storage; hence, the statistical difference could not be calculated between Th1 and Th2. We were unable to perform intracellular cytokine staining (e.g., IFN-α). Including Delta and Omicron-specific peptides to study variant-specific cell-mediated immune response would have provided a meaningful comparison to the results obtained with the Wuhan variant-specific pepmix. The number of HCWs in the study site (NIMHANS) who received COVAXIN was very few. Hence, a cross-sectional study could not be considered. Lastly, this study did not incorporate the frequency of breakthrough infections after single or double doses of the vaccine, which limits our ability to assess their impact on memory and B-cell responses.
A key element of the disease prevention approach is the production and distribution of efficient vaccinations. This must be based on precise knowledge of the dynamics of immunisation-induced immune responses against the realm of developing SARS-CoV-2 variants. This study highlighted the need for booster doses, especially among high-risk groups like HCWs, further monitoring of vaccine-induced immunity, and the role of cell-mediated immunity in long-term immune protection. It is widely accepted, supported by epidemiological evidence, that hybrid immunity provides greater COVID-19 protection than either prior infection immunity or vaccine-induced immunity13,42, providing crucial insights to optimise vaccine strategies. Each of the antigen exposure types—infection-induced memory, vaccine-induced memory, and hybrid immunity - has unique immunological memory properties that are essential to the reported immunity in each instance.
Financial support& sponsorship
This study received funding support by a grant from the Indian Council of Medical Research (VIR/COVID-9/16/2021/ECD-1).
Conflicts of Interest
None.
Use of Artificial Intelligence (AI)-Assisted Technology for manuscript preparation
The authors confirm that there was no use of AI-assisted technology for assisting in the writing of the manuscript and no images were manipulated using AI.
References
- Coronavirus Disease 2019-COVID-19. Clin Microbiol Rev. 2020;33:e00028-20.
- [CrossRef] [PubMed] [PubMed Central] [Google Scholar]
- Adaptive immunity to SARS-coV-2 and COVID-19. Cell. 2021;184:861-80.
- [CrossRef] [PubMed] [PubMed Central] [Google Scholar]
- T cell immunity to SARS-coV-2 following natural infection and vaccination. Biochem Biophys Res Commun. 2021;538:211-7.
- [CrossRef] [PubMed] [PubMed Central] [Google Scholar]
- Immunogenicity of clinically relevant SARS-coV-2 vaccines in nonhuman primates and humans. Sci Adv. 2021;7:eabe8065.
- [CrossRef] [PubMed] [PubMed Central] [Google Scholar]
- Persistent B cell memory after SARS-coV-2 vaccination is functional during breakthrough infections. Cell Host Microbe. 2022;30:400-8.
- [CrossRef] [PubMed] [PubMed Central] [Google Scholar]
- Safety and immunogenicity of two RNA-based covid-19 vaccine candidates. N Engl J Med. 2020;383:2439-50.
- [CrossRef] [PubMed] [PubMed Central] [Google Scholar]
- Phase 1/2 trial of SARS-coV-2 vaccine chAdOx1 nCoV-19 with a booster dose induces multifunctional antibody responses. Nat Med. 2021;27:279-88.
- [CrossRef] [PubMed] [Google Scholar]
- Comparison of vaccine-induced antibody neutralization against SARS-coV-2 variants of concern following primary and booster doses of COVID-19 vaccines. Front Med (Lausanne). 2022;9:994160.
- [CrossRef] [PubMed] [PubMed Central] [Google Scholar]
- Safety and immunogenicity of the ChAdOx1 nCoV-19 vaccine against SARS-CoV-2: A preliminary report of a phase 1/2, single-blind, randomised controlled trial. Lancet. 2020;396:467-78.
- [CrossRef] [PubMed] [PubMed Central] [Google Scholar]
- T cell and antibody responses induced by a single dose of chAdOx1 nCoV-19 (AZD1222) vaccine in a phase 1/2 clinical trial. Nat Med. 2021;27:270-8.
- [CrossRef] [PubMed] [Google Scholar]
- COVID-19 vaccine BNT162b1 elicits human antibody and TH1 T cell responses. Nature. 2020;586:594-9.
- [CrossRef] [PubMed] [Google Scholar]
- Impact of prior vaccination with CovishieldTM and Covaxin® on mortality among symptomatic COVID-19 patients during the second wave of the pandemic in south India during April and May 2021: A cohort study. Vaccine. 2022;40:2107-13.
- [CrossRef] [PubMed] [PubMed Central] [Google Scholar]
- Safety and efficacy of the ChAdOx1 nCoV-19 vaccine (AZD1222) against SARS-CoV-2: an interim analysis of four randomised controlled trials in Brazil, South Africa, and the UK. Lancet. 2021;397:99-111.
- [CrossRef] [PubMed] [PubMed Central] [Google Scholar]
- Study of immunogenicity, safety and efficacy of Covishield vaccine among health care workers in a tertiary cardiac care centre. Indian J Med Microbiol. 2022;40:200-3.
- [CrossRef] [PubMed] [PubMed Central] [Google Scholar]
- Transient plasma cell dyscrasia in COVID-19 patients linked to IL-6 triggering. Microbes Infect. 2021;23:104808.
- [CrossRef] [PubMed] [PubMed Central] [Google Scholar]
- Anti-N SARS-coV-2 assays for evaluation of natural viral infection. J Immunol Methods. 2023;518:113486.
- [CrossRef] [Google Scholar]
- Development and validation of the elecsys anti-SARS-coV-2 immunoassay as a highly specific tool for determining past exposure to SARS-coV-2. J Clin Microbiol. 2020;58:e01694-20.
- [CrossRef] [PubMed] [PubMed Central] [Google Scholar]
- Diagnostic accuracy comparison of three fully automated chemiluminescent immunoassay platforms for the detection of SARS-coV-2 antibodies. J Virol Methods. 2021;292:114121.
- [CrossRef] [PubMed] [PubMed Central] [Google Scholar]
- Design and performance characteristics of the elecsys anti-SARS-coV-2 S assay. Front Immunol. 2022;13:1002576.
- [CrossRef] [PubMed] [PubMed Central] [Google Scholar]
- Serological survey for SARS-coV-2 antibodies among tribal communities of Odisha post-second wave. Indian J Med Res. 2022;156:284-90.
- [CrossRef] [PubMed] [PubMed Central] [Google Scholar]
- Performance evaluation of the roche elecsys anti-SARS-coV-2 S immunoassay. J Virol Methods. 2021;297:114271.
- [CrossRef] [PubMed] [PubMed Central] [Google Scholar]
- Standardizing flow cytometry immunophenotyping analysis from the human Immunophenotyping consortium. Sci Rep. 2016;6:20686.
- [CrossRef] [PubMed] [PubMed Central] [Google Scholar]
- Standardizing immunophenotyping for the human immunology project. Nat Rev Immunol. 2012;12:191-200.
- [CrossRef] [PubMed] [PubMed Central] [Google Scholar]
- Immunological memory to SARS-coV-2 assessed for up to 8 months after infection. Science. 2021;371:eabf4063.
- [CrossRef] [PubMed] [PubMed Central] [Google Scholar]
- Unbiased immunome characterisation correlates with COVID-19 mRNA vaccine failure in immunocompromised adults. Front Immunol. 2024;15:1405217.
- [CrossRef] [PubMed] [PubMed Central] [Google Scholar]
- Durability of chAdOx1 nCoV-19 (Covishield®) vaccine induced antibody response in health care workers. Vaccines (Basel). 2022;11:84.
- [CrossRef] [PubMed] [PubMed Central] [Google Scholar]
- Humoral immunity due to long-lived plasma cells. Immunity. 1998;8:363-72.
- [CrossRef] [PubMed] [Google Scholar]
- Protection of vaccination versus hybrid immunity against infection with COVID-19 omicron variants among health-care workers. Vaccine. 2022;40:7195-200.
- [CrossRef] [PubMed] [PubMed Central] [Google Scholar]
- Immune response to recombinant adenovirus in humans: Capsid components from viral input are targets for vector-specific cytotoxic T lymphocytes. J Virol. 2000;74:7678-82.
- [CrossRef] [PubMed] [PubMed Central] [Google Scholar]
- Neutralizing antibodies and CD8+ T lymphocytes both contribute to immunity to adenovirus serotype 5 vaccine vectors. J Virol. 2004;78:2666-73.
- [CrossRef] [PubMed] [PubMed Central] [Google Scholar]
- Moderate to severe SARS-coV-2 infection primes vaccine-induced immunity more effectively than asymptomatic or mild infection. NPJ Vaccines. 2022;7:122.
- [CrossRef] [PubMed] [PubMed Central] [Google Scholar]
- Symptomatology during previous SARS-coV-2 infection and serostatus before vaccination influence the immunogenicity of BNT162b2 COVID-19 mRNA vaccine. Front Immunol. 2022;13:930252.
- [CrossRef] [PubMed] [PubMed Central] [Google Scholar]
- Defining the features and duration of antibody responses to SARS-coV-2 infection associated with disease severity and outcome. Sci Immunol. 2020;5:eabe0240.
- [CrossRef] [PubMed] [PubMed Central] [Google Scholar]
- Characterization of antibody response in asymptomatic and symptomatic SARS-coV-2 infection. PLoS One. 2021;16:e0253977.
- [CrossRef] [PubMed] [PubMed Central] [Google Scholar]
- COVID-19 confirmed patients with negative antibodies results. BMC Infect Dis. 2020;20:698.
- [CrossRef] [PubMed] [PubMed Central] [Google Scholar]
- Neutralizing antibody responses in COVID-19 convalescent sera. J Infect Dis. 2021;223:47-55.
- [CrossRef] [PubMed] [PubMed Central] [Google Scholar]
- T cell immunity to SARS-coV-2. Semin Immunol. 2021;55:101505.
- [CrossRef] [PubMed] [PubMed Central] [Google Scholar]
- Cellular interferon-gamma and interleukin-2 responses to SARS-coV-2 structural proteins are broader and higher in those vaccinated after SARS-coV-2 infection compared to vaccinees without prior SARS-coV-2 infection. PLoS One. 2022;17:e0276241.
- [CrossRef] [PubMed] [PubMed Central] [Google Scholar]
- Functional SARS-coV-2-specific immune memory persists after mild COVID-19. Cell. 2021;184:169-83.
- [CrossRef] [PubMed] [PubMed Central] [Google Scholar]
- Long-Lasting T cell responses in BNT162b2 COVID-19 mRNA vaccinees and COVID-19 convalescent patients. Front Immunol. 2022;13:869990.
- [CrossRef] [PubMed] [PubMed Central] [Google Scholar]
- Neutralizing antibodies to SARS-coV-2 variants of concern including delta and omicron in subjects receiving mRNA-1273, BNT162b2, and Ad26.COV2.S vaccines. J Med Virol. 2022;94:5678-90.
- [CrossRef] [PubMed] [PubMed Central] [Google Scholar]


