
Translate this page into:
Diagnostic accuracy of cfDNA levels in gallbladder cancer: A study using qPCR & threshold evaluation
For correspondence: Dr Ashmeet Kaur, Department of Pathology, Sawai Man Singh Medical College, Jaipur, Rajasthan 302 004, India e-mail: ashmeetkochar@gmail.com
-
Received: ,
Accepted: ,
Abstract
Background & objectives
Gallbladder cancer (GBC) is a highly aggressive malignancy with a poor prognosis, often due to late-stage diagnosis. Existing diagnostic methods are invasive and not always feasible in resource-limited settings. Circulating free DNA (cfDNA) has emerged as a potential non-invasive biomarker for malignancies, including GBC. This study aimed to evaluate the diagnostic accuracy of cfDNA levels in distinguishing GBC patients from healthy controls, considering its potential for early detection and personalised treatment.
Methods
This case-control study included 42 newly diagnosed GBC affected individuals and 15 age- and sex-matched healthy controls. Plasma cfDNA was extracted using a bead-based protocol and quantified through quantitative PCR (qPCR) targeting the β-globin gene. Diagnostic thresholds were identified using Receiver Operating Characteristics (ROC) and precision-recall curve analyses, assessing sensitivity, specificity, and predictive values.
Results
cfDNA levels were significantly elevated in GBC patients compared to controls (P<0.05), with a mean cfDNA level of 721 ng/ml. Four diagnostic offering distinct clinical thresholds were identified: 75.5 ng/ml, 130 ng/ml, 188 ng/ml, and 372.92 ng/ml. The ROC curve demonstrated an area under the curve (AUC) of 0.94, indicating high diagnostic accuracy. cfDNA achieved high sensitivity (97.6% at 75.5 ng/ml) and 100 per cent specificity at 188 ng/ml.
Interpretation & conclusion
cfDNA serves as a reliable, non-invasive biomarker for GBC diagnosis, providing high diagnostic accuracy and utility in early detection and disease monitoring. These findings highlight cfDNA’s potential as both a standalone diagnostic tool and a complementary marker to traditional tumour markers, enhancing diagnostic precision and aiding in personalised medicine. Its integration into diagnostic protocols can be particularly valuable in resource-limited settings.
Keywords
cfDNA
gallbladder cancer
liquid biopsy
qPCR
threshold

Gallbladder cancer (GBC) is a relatively rare malignancy with notable geographical variations in its incidence and prevalence 1 . GLOBOCAN 2020 reported 1,15,949 new GBC cases globally, making it the sixth common gastrointestinal cancer 1 . Despite regional variations, GBC remains a significant public health concern in India, particularly among women in northern States, as highlighted by data from the National Cancer Registry Programme (NCRP) 2,3 .
GBC often goes undetected until it reaches an advanced stage due to its anatomical location and vague symptoms, leaving only about 25 per cent of patients eligible for surgical intervention after diagnosis 4 . The prognosis is grim even among those undergoing surgery, with recurrence rates of 60-70 per cent and a five-year survival rate ranging from five per cent to 15 per cent 5-7 . The primary and standard treatment for GBC continues to be a comprehensive model centred around radical surgical resection, while patients with advanced, unresectable, or metastatic GBC are treated with gemcitabine and platinum-based chemotherapies 7,8 .
The therapeutic landscape is evolving with recent advancements in sequencing technology. Molecular profiling of GBC has led to the development of novel targeted and immunotherapeutic drugs, with promising targets including the epidermal growth factor receptor (EGFR), fibroblast growth factor receptor (FGFR), human epidermal growth factor receptor 2 (HER2), and PD-1/PD-L1. These advancements represent a shift in the treatment paradigm for gallbladder cancer, offering new hope through targeted therapies and immunotherapy 9,10 .
Despite advancements in molecular profiling and imaging technologies, GBC is often diagnosed at advanced stages, leading to poor prognosis and limited treatment options. Liquid biopsy, particularly circulating free DNA (cfDNA), has emerged as a promising non-invasive biomarker for cancer detection and monitoring, overcoming many limitations of traditional diagnostic methods. cfDNA, originating from tumour cell necrosis in cancer patients, serves as a biomarker for distinguishing malignancies from healthy cells 11 .
Previous studies, such as Kumari et al 12 , have explored cfDNA’s potential in detecting GBC, focusing on its integrity and methylation status. However, critical gaps remain in its clinical application, particularly in establishing multiple diagnostic thresholds tailored to clinical scenarios.
This study aims to assess the diagnostic potential of cfDNA quantification in distinguishing GBC patients from healthy individuals. By establishing clinically applicable diagnostic thresholds and examining the relationship between cfDNA levels and demographic and clinico-pathological factors, the study seeks to enhance the utility of cfDNA as a biomarker for early detection, disease monitoring, and improved clinical decision-making in GBC.
Materials & Methods
This case-control study was conducted with participants recruited consecutively from the departments of Gastroenterology, Surgical Oncology, Gastrointestinal Surgery, Radiation Oncology, and Pathology, Sawai Man Singh Medical College (SMS), Jaipur, Rajasthan, India after obtaining the ethical approval from the Institutional Review Board. A written informed consent was obtained from all participants. All demographic and clinical details, laboratory investigations, and study participants imaging were meticulously recorded.
The study included 42 newly diagnosed adult individuals affected with GBC. Diagnoses were established using a combination of clinical presentation, imaging such as ultrasound (USG), computed tomography (CT), magnetic resonance imaging (MRI), and Fine Needle Aspiration Cytology (FNAC) or biopsy wherever feasible. All cases were identified as suspected for malignancy when USG, with CT and MRI findings were consistent for GBC in 31 cases. FNAC confirmed malignancy in 23 cases, and a biopsy was conducted in four cases to establish the diagnosis. Due to the advanced stage and critical condition of many patients, histopathological confirmation was not possible in all cases. Individuals with prior chemotherapy or radiotherapy, those with significant clinical disorders, or those with inadequate samples were excluded from the study. Additionally, 15 healthy individuals, matched for age and sex to the cases, were included as controls.
Procedure
cfDNA was extracted from plasma samples of both GBC affected individuals and controls using a bead-based protocol from MagMAX CORE Nucleic Acid Purification kit, Applied Biosystems (MS, USA). Following blood sample centrifugation, cfDNA was extracted from plasma. The extraction involved mixing plasma with a lysis buffer, adding magnetic beads coated with DNA-binding ligands to bind cfDNA, and separating the bound cfDNA from other impurities using a magnetic separator. Purified cfDNA was eluted and used for downstream analyses, including amplification of the β-globin gene via quantitative SYBR Green (SYBR Green Universal Master mix, Applied Biosystems, MS, USA) real-time PCR.
qPCR and standard curve
The cfDNA was quantified using qPCR on the CFX96 Real-Time System, following the Applied Biosystems protocol. The qPCR reactions were performed using SYBR Green Supermix with specific primers (forward: GTGCACCTGACTCCTGAGA; reverse: CCTTGATACCAACCTGCCCAG) 13,14 under the following cycling conditions: an initial denaturation at 95°C for 9 min, followed by 35 cycles of 95°C for 30 sec, 55°C for 30 sec, and 72°C for 30 sec. A standard curve (Fig. 1; A and B) was established by plotting Ct values against the log₁₀ of known DNA concentrations, modelled using polynomial regression (degree 3), and R2 was calculated 15 .
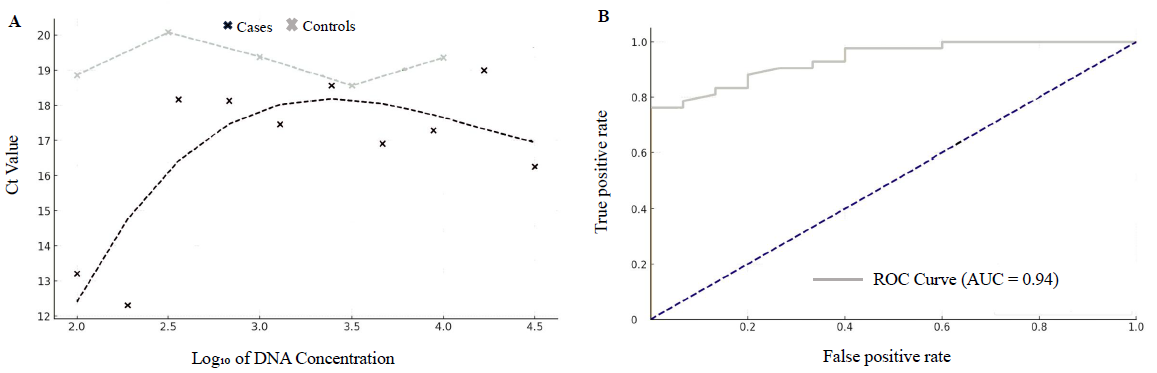
- (A) Regression analysis showing a comparison of Ct values and log10 DNA concentration between cases and controls. (B) Receiver operating characteristics (ROC) curve for diagnostic performance evaluation of cfDNA.
The diagnostic capabilities of cfDNA were further evaluated by plotting receiver operating characteristic (ROC) curves (Fig. 1B) and calculating sensitivity, specificity, positive predictive value (PPV), and negative predictive value (NPV) at various cfDNA concentration thresholds. Four key thresholds (75.5 ng/ml, 130 ng/ml, 188 ng/ml, and 372.92 ng/ml) were identified, each offering different clinical advantages based on the balance between sensitivity and specificity. Precision-recall curves were also generated to visualise the trade-offs between identifying true cases and avoiding false positives.
Results
The demographic and clinico-pathological characteristics of the affected individuals and control groups are summarised in table I. The age range of cancer affected individuals varied from 31 to 75 yr, with a mean age of 55.07±12.14 yr, whereas the control group had a mean age of 19.38±0.68 yr. The gender distribution in the cancer group showed a male-to-female ratio of 16:25, which was matched in the control group.
| Category | Measure/characteristic | Cases | Significance/association (P value) |
|---|---|---|---|
| Demographic | Age (mean±SD) |
55.07±12.14 yr Controls-19.38±0.68 yr |
Not significant (P=0.409) |
| Gender distribution |
Male: 17, Female: 25 Controls-Male: 7, Female: 8 |
Significant (P=0.045) | |
| Clinicopathological | Tumour stage | 95.2% in Stage 4, 2.4% in Stages 2 and 3 | Not significant (P=0.132) |
| Lymph node involvement | 42.86% | Not significant (P=0.806) | |
| Wall thickness > 5 mm | 52.4% | Significant (P=0.044) | |
| Jaundice | 69% | Significant (P=0.035) | |
| Pruritus | 35.71% | Significant (P=0.185) | |
| Ascites | 38.1% | Not significant (P=0.744) | |
| Serum biomarkers | Alkaline phosphatase (ALP) | Elevated in 64.29% of affected individuals | Weak correlation with cfDNA (P=0.089) |
| Alpha-fetoprotein (AFP) | Elevated in 7.14% of affected individuals | No significant correlation with cfDNA (P=0.13) | |
| Carcinoembryonic antigen (CEA) | Elevated in 14.29% of affected individuals | No significant correlation with cfDNA (P=0.10) | |
| cfDNA distribution | Mean cfDNA levels |
721.18 ng/ml Controls-81.15 ng/ml |
Significant (P<0.005) |
SD, standard deviation
Most of the cancer affected individuals were at stage IV (95.2%), with a few at stages II and III. Lymph node involvement and wall thickness >5mm were present, respectively in 52.4 per cent and 42.86 per cent of cancer affected individuals. Additionally, jaundice was observed in 69 per cent, pruritus in 35.71 per cent, and ascites in 38.1 per cent of the affected individuals. Our study’s reliance on imaging and FNAC for GBC diagnosis highlights the real-world challenges of managing advanced-stage patients, where histopathological confirmation may not be feasible. While our study focused on critically ill individuals with confirmed or highly suspected malignancy, future research should aim to include benign conditions to provide a comprehensive assessment of cfDNA’s diagnostic utility.
Analysis of tumour markers revealed notable trends. Alkaline phosphatase (ALP) was elevated in 64.29 per cent of affected individuals, making it the most common marker, potentially indicating liver metastasis. In contrast, Alpha-fetoprotein (AFP) was elevated in only 7.14 per cent of affected individuals, being the least common marker. Carcinoembryonic antigen (CEA) levels were elevated in 14.29 per cent of affected individuals.
Demographic and clinico-pathological association
The study cohort included GBC affected individuals with a mean age ± standard deviation of 55.07±12.14 yr, compared to 19.38±0.68 yr in the control group. The age difference was not statistically significant (P=0.409). Gender distribution in the cancer group consisted of 17 males and 25 females, while the control group included seven males and eight females, showing a significant association between cfDNA levels and gender (P=0.045). The statistical analyses of cfDNA levels are presented in table I.
Tumour staging revealed that 95.2 per cent of GBCs were at stage IV, with no significant association between staging and cfDNA levels (P=0.132). Tumour wall thickness greater than 5 mm was observed in 52.4 per cent of cases. Although cfDNA levels were higher in this group (mean± standard deviation: 1420.8 ng/ml ± 866.1) compared to cases with thickness ≤5 mm (802.9 ng/ml ± 1405.3); the association was not statistically significant (P=0.21).
Additionally, jaundice was present in 69 per cent of cases, and a significant correlation between jaundice and cfDNA levels was observed (P=0.035). A stratified analysis of cfDNA levels by jaundice status revealed significantly higher cfDNA levels in jaundiced individuals (1911.5±1532.2 ng/ml) compared to non-jaundiced individuals (368.1±297.4 ng/ml), with a statistically significant difference (P=0.011). This finding highlights the potential confounding effect of elevated bilirubin on cfDNA levels.
The association between cfDNA levels and both metastasis and tumour size (measured by wall thickness) were evaluated using the Mann-Whitney U test. Results showed that cfDNA levels were significantly elevated in affected individuals with metastasis (P=0.044), suggesting a correlation between cfDNA levels and disease spread.
Although the analysis between age groups (>50 vs. ≤50) and lymph node involvement did not reach statistical significance, trends indicated higher cfDNA levels in younger patients and those with lymph node involvement, potentially reflecting a more aggressive disease course in these subgroups. Box plots (Fig. 2) illustrate cfDNA levels by gender, jaundice presence, and tumour size, supporting cfDNA’s role as a potential biomarker of GBC severity.
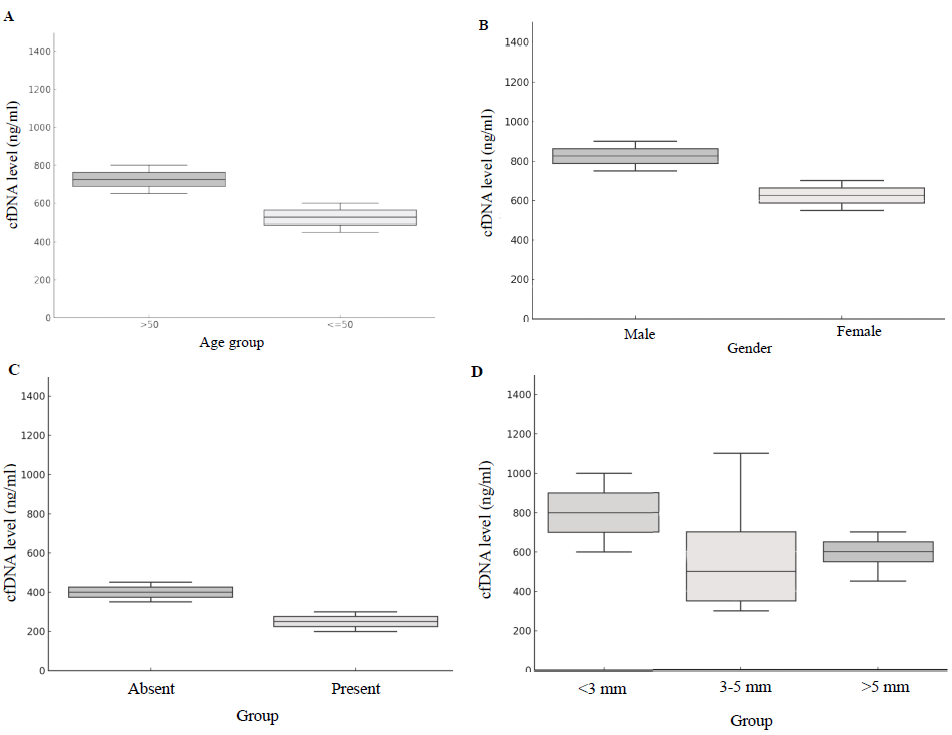
- The box plots illustrate the relationship between cfDNA levels and various demographic and clinico-pathological characteristics. (A) by age group; (B) gender; (C) jaundice and (D) wall thickness.
Association with serum biomarkers
ALP was the most commonly elevated tumour marker (64.29%), followed by CEA (14.29%); AFP was the least elevated (7.14%). The correlation between cfDNA levels and common tumour markers was weak (AFP, P=0.13 ad CEA, P=0.10), with ALP showing only a slight positive correlation (0.089). This suggests that cfDNA levels increased independently of traditional markers like AFP and CEA in this cohort.
Distribution analysis of cfDNA levels
The relationship between Ct values and cfDNA concentration was modelled (Fig. 1A) using polynomial regression (degree 3), yielding R2 values of 0.6621 for cases and 0.9999 for controls. These high R2 values demonstrate our qPCR assay’s reliability. The QQ plots (Fig. 3) showed deviations from normality in both groups, with a more pronounced deviation in cancer patients, further supporting cfDNA as a biomarker.
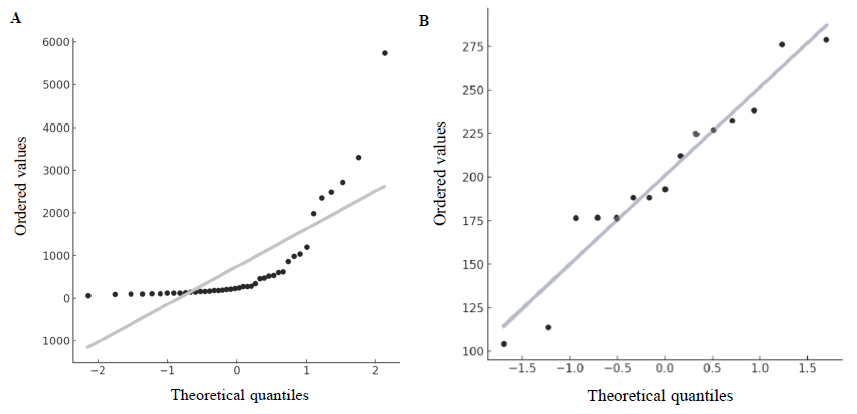
- The QQ plots compare the cfDNA distributions for the cases (A) and controls (B) against a normal distribution.
Diagnostic accuracy of cfDNA
cfDNA levels were markedly elevated in the cancer group (721.18 ng/ml) compared to the control group (81.15 ng/ml, P<0.005). These findings underscore the potential of cfDNA as a reliable biomarker for distinguishing individuals affected with GBC from controls.
The ROC curve (Fig. 1B) for cfDNA levels in GBC affected individuals was plotted, and the AUC was calculated. An AUC of 0.94 was obtained, indicating that our model had a 94 per cent chance of accurately distinguishing between GBC affected individuals and controls.
Precision-recall curve analysis (Fig. 4; A, B and C) was used to evaluate the diagnostic capability of cfDNA levels in distinguishing between healthy controls and cancer affected individuals. We identified four key cfDNA thresholds (75.5 ng/ml, 130 ng/ml, 188 ng/ml, and 372.92 ng/ml) by expanding the PR curves (Fig. 4A), each offering distinct clinical benefits. The 75.5 ng/ml threshold, with high sensitivity (97.6%), is ideal for initial screenings, while the 130 ng/ml threshold provided balanced sensitivity (75%) and specificity (70%), suitable for follow-up testing (Table II). The 188 ng/ml threshold excelled in precision (92%) and specificity (100%), making it optimal for diagnostic confirmation. The 372.92 ng/ml threshold maximizes specificity (90%), which is ideal for confirmatory testing (Fig. 4B).
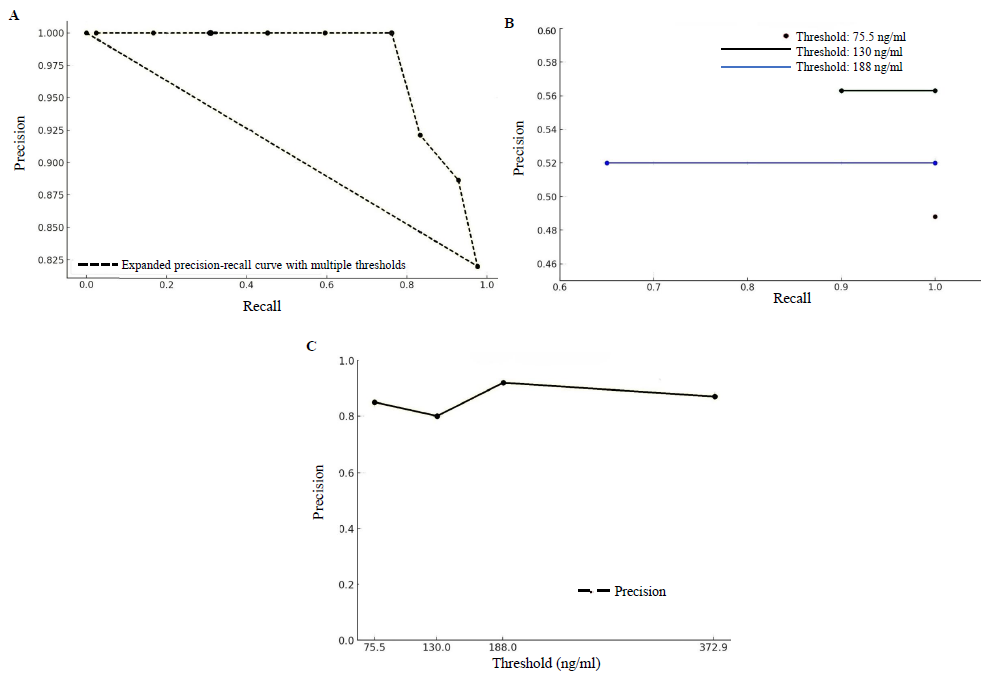
- (A)The expanded precision-recall curve shows the overall performance of the model across multiple thresholds, illustrating the trade-offs between precision and recall. (B) The precision-recall curves at specified thresholds (75.5 ng/ml, 130 ng/ml, and 188 ng/ml) displays their effect on the model’s ability to distinguish between cancer affected individuals and healthy controls. (C) This figure demonstrates the precision of the model at various cfDNA concentration thresholds.
| Threshold (ng/ml) | Sensitivity (%) | Specificity (%) | Significance |
|---|---|---|---|
| 75.5 | 97.6 | 40 | Initial screening; critical to detect as many cases as possible |
| 130 | 75 | 70 | Follow up testing; balanced approach to detect cases and minimize false positives |
| 188 | 59.5 | 100 | Diagnosis confirmation; minimizing false positives is crucial |
| 372.92 | 50 | 90 | Final confirmatory testing; ensuring high accuracy in positive results |
Precision at different thresholds: 75.5 ng/ml, 130 ng/ml, 188 ng/ml, and 372.92 ng/ml were calculated as 82 per cent, 79 per cent, 86 per cent, and 81 per cent, respectively (Fig. 4C). The bar graphs of PPV, NPV, sensitivity, and specificity at each threshold, visually illustrate the diagnostic accuracy of cfDNA levels and provide a clear representation of the test’s performance (Supplementary Figure).
Discussion
GBC is highly prevalent in northern and northeastern States, where it ranks among the top cancers 2,3 . The disease is often detected at an advanced stage, leading to poor life expectancy, lower progression-free survival (PFS), and overall survival (OS) rates 15 . Its aggressive nature and resistance to conventional chemotherapy make early detection and intervention crucial. Association with chronic inflammation and gallstones further complicates diagnosis, highlighting the need for better screening tools. Current treatment options are limited, with surgery as the primary intervention, particularly in the early stages. Emerging liquid biopsy techniques using cfDNA offer a promising non-invasive diagnostic tool, overcoming the limitations of traditional tissue-based biopsies, providing comprehensive genomic profiling, and enabling the study of tumour evolution and resistance, which could improve GBC management in high-incidence regions 15 .
This study utilised a bead-based extraction protocol for cfDNA isolation, which offers several advantages over the silica-based method used in prior studies, such as the one by Kumari et al 12 . Bead-based protocols provide higher efficiency, reduced contamination risk, and improved cfDNA recovery, ensuring more accurate quantification and analysis. These advancements enhance the reliability of cfDNA as a diagnostic biomarker and make it more adaptable for routine use, particularly in resource-limited settings. By addressing methodological gaps in previous research, this study contributes to refining cfDNA-based diagnostics for GBC.
Our findings align with studies by Sakamoto et al 11 , Ying et al 16 , and Kumari et al 12 , each supporting cfDNA as a potential biomarker for distinguishing GBC from benign conditions and advanced disease stages.
GBC in India shows a clear association with age, sex, and regional distribution and impacts life expectancy significantly. The disease predominantly affects older adults, with most cases occurring in individuals over 50 years of age 2,3 . Significantly elevated levels were observed in GBC cases compared to controls. Its frequency is two to three times more common in women, likely due to hormonal factors and higher gallstone prevalence 2,3,15 . While the findings are promising, the gender imbalance between the study and control groups should be considered, and larger studies are needed to confirm these results.
Ying et al 16 also found elevated cfDNA in GBC patients to be associated with advanced stages, jaundice, and lymph node involvement, comparable to our findings. However, their use of a chemiluminescence DNA biosensor system highlighted the high sensitivity and specificity of cfDNA as a non-invasive diagnostic marker, comparable to traditional qPCR methods.
A stratified analysis of cfDNA levels based on jaundice status revealed significantly elevated levels in jaundiced patients (1911.5±1532.2 ng/ml) compared to non-jaundiced patients (368.1±297.4 ng/ml), with a statistically significant difference (P=0.011). These findings underscored the potential confounding influence of elevated bilirubin on cfDNA levels. Incorporating jaundice-related variables is crucial for refining cfDNA-based diagnostic thresholds, particularly in GBC patients presenting with jaundice.
Wintachai et al 17 , in a study on cholangiocarcinoma, reported that cfDNA levels demonstrated superior diagnostic efficacy compared to CEA and CA19-9. Similarly, our study highlighted cfDNA’s diagnostic potential, despite weak correlations observed with traditional tumour markers such as CA-125, CA 19.9, AFP, and CEA. In contrast to these markers, cfDNA demonstrated superior diagnostic accuracy, achieving an AUC of 0.94 in ROC analysis, with high sensitivity (97.6% at 75.5 ng/ml) and specificity (100% at 188 ng/ml).
These findings underscored cfDNA’s unique diagnostic value as both a standalone marker and complementary tool to conventional tumour markers, enhancing diagnostic capabilities for GBC. While traditional markers showed limited performance, cfDNA offered insights to refine diagnostic strategies, particularly in complex scenarios where conventional markers alone could be insufficient. The integration of cfDNA with traditional biomarkers has the potential to improve diagnostic accuracy and broaden its application across patient populations, including those with benign gallbladder pathologies.
cfDNA levels were analysed as a potential prognostic marker by categorizing tumour thickness into ≤5 mm and >5 mm groups. The mean cfDNA levels were higher in the >5 mm group, but the differences were statistically insignificant (t=1.29, P=0.21). This result may reflect the complexity of cfDNA release mechanisms or the variability within the >5mm group. These findings highlight the importance of larger datasets to better characterise the relationship between tumour thickness and cfDNA levels.
Our findings established cfDNA as a versatile biomarker for GBC, offering multiple diagnostic thresholds with distinct clinical applications. Unlike previous studies 12 , which reported a single threshold (74.37 ng/ml) with moderate diagnostic accuracy, our study provided a spectrum of diagnostic thresholds tailored to specific clinical scenarios, significantly enhancing cfDNA’s applicability.
Furthermore, while earlier research 12 emphasised cfDNA’s integrity and global methylation status, it did not explore demographic or clinical factors influencing cfDNA levels. In contrast, our study identified significant associations between elevated cfDNA levels and factors such as gender, jaundice, and metastasis, providing a comprehensive understanding of cfDNA’s role in GBC progression and severity. This broader perspective underscores cfDNA’s diagnostic and prognostic value, particularly in resource-limited settings where traditional diagnostic methods may be unfeasible.
Additionally, our robust statistical analyses, including polynomial regression and PR curve evaluations, demonstrated superior diagnostic accuracy (AUC=0.94) and reliability. High R2 values for qPCR calibration curves further validated our study’s methodological advancements. These findings collectively underscored cfDNA’s potential as a multifaceted biomarker for GBC suitable for a wide range of clinical applications.
By incorporating advanced statistical modelling, tailored diagnostic thresholds, and an in-depth analysis of clinicopathological correlations, this study builds upon and extends the foundational work of Kumari et al 12 , offering significant advancements in the field of cfDNA-based diagnostics for GBC.
A limitation of this study is the absence of benign controls, such as chronic cholecystitis, which could better evaluate cfDNA’s specificity in differentiating malignancies from non-malignant conditions. However, the stratified analysis of cfDNA levels in jaundiced versus non-jaundiced patients provided valuable insights into bilirubin’s potential confounding effect, emphasizing the importance of expanding patient cohorts for a more comprehensive evaluation.
Sakamoto et al 11 offered a unique perspective by examining cfDNA fragment lengths rather than overall levels. They observed that longer fragments were significantly reduced in advanced GBC cases with lymph node metastasis, while shorter fragments remained unchanged. This suggests that fragment length analysis could complement overall cfDNA levels in identifying advanced stages. Integrating fragment length analysis and mutation profiling into cfDNA methodologies has the potential to provide additional diagnostic and prognostic insights. Mutation profiling could uncover key genetic alterations associated with disease progression, while fragment size distribution might refine the detection of advanced or metastatic cases. Combining these approaches will likely enhance the sensitivity, specificity, and clinical utility of cfDNA-based diagnostics in GBC.
Given its non-invasive nature and high diagnostic accuracy, cfDNA testing holds promise for integration into diagnostic protocols, particularly in regions with limited access to advanced tissue-based diagnostics, thereby enabling precision oncology in under-resourced settings. To support its clinical adoption, research should evaluate the cost-effectiveness of bead-based cfDNA extraction and focus on standardising diagnostic thresholds to ensure reproducibility and scalability across diverse healthcare environments.
To the best of our knowledge, very few studies have explored cfDNA as a biomarker for GBC. This study underscores cfDNA’s potential as a non-invasive, sensitive, and specific tool for cancer screening. With the high prevalence and late-stage diagnosis of GBC, cfDNA could play a pivotal role in early detection and personalised treatment, particularly in resource-limited settings where traditional tissue-based methods are often unfeasible.
Our data revealed cfDNA levels ranging from 63.5 to 5740 ng/ml, with a mean of approximately 721 ng/ml, indicative of advanced disease stages. Elevated cfDNA levels in GBC affected individuals with lymph node involvement, jaundice, and metastasis further highlighted its utility as a marker of disease severity.
Overall, this study highlights the potential of cfDNA quantification as a non-invasive and reliable biomarker for GBC diagnosis, offering high sensitivity and specificity. By establishing multiple diagnostic thresholds tailored to distinct clinical scenarios, our findings address critical gaps in existing literature and provide a robust framework for early detection, monitoring disease progression, and personalised management of GBC. The practicality and reproducibility of cfDNA quantification make it particularly valuable in resource-limited settings where traditional diagnostic methods may be inaccessible.
In conclusion, cfDNA quantification represents a significant advancement in non-invasive cancer diagnostics, offering a scalable and effective solution for improving GBC diagnosis and, thereby, the outcome, particularly in regions with limited healthcare infrastructure.
Acknowledgment
Author acknowledges Dr. Hemant Malhotra, former Head of the Department of Medical Oncology, SMS Medical College, Jaipur, for his invaluable guidance and mentorship throughout this project. Authors are also thankful to Dr. Vishwamohan Katoch, Chairman of LRAC, for his insightful guidance and support. Authors also acknowledges faculty and staff of MDRU for their valuable input and contributions. We also acknowledge the contributions of Dr. Ranjana Solanki, former Nodal Officer of MDRU, along with Dr. Anubhav Jain, Senior Resident Gastroenterology, and MDRU Research Scientists Dr(s) Shipra Bhargav, Debashish Biswas, Anu Shekhawat, Bhubaneswar, and Bhuvanesh Kalal, for their assistance and expertise. A special note of appreciation goes to Dr. Bharti Malhotra for her expert guidance and valuable feedback.
Financial support & sponsorship
This study received funding from the Multidisciplinary Research Unit, Grant Number: 05/MDRU Lab/18.
Conflicts of Interest
None.
Use of Artificial Intelligence (AI)-Assisted Technology for manuscript preparation
The authors confirm that there was no use of AI-assisted technology for assisting in the writing of the manuscript and no images were manipulated using AI.
References
- Cancer Today. Available from: https://gco.iarc.fr , accessed on September 1, 2024.
- Indian Council of Medical Research (ICMR) - National Cancer Registry Programme (NCRP). Consolidated Report of Population Based Cancer Registries 2012-2016 and 2020-2021 data. Available from: https://www.ncdirindia.org/All_Reports/PBCR_REPORT_2012_2014/ALL_CONTENT/PDF_Printed_Version/Preliminary_Pages_Printed.pdf , accessed on September 1, 2024.
- Gallbladder cancer: Current and future treatment options. Front Pharmacol. 2023;14:1183619.
- [CrossRef] [PubMed] [PubMed Central] [Google Scholar]
- Gallbladder cancer: Epidemiology and outcome. Clin Epidemiol. 2014;6:99-109.
- [CrossRef] [PubMed] [PubMed Central] [Google Scholar]
- Gallbladder cancer epidemiology, pathogenesis and molecular genetics: Recent update. World J Gastroenterol. 2017;23:3978-98.
- [CrossRef] [PubMed] [PubMed Central] [Google Scholar]
- Gallbladder cancer. Nat Rev Dis Primers. 2022;8:69.
- [CrossRef] [PubMed] [PubMed Central] [Google Scholar]
- Gallbladder carcinoma: Prognostic factors and therapeutic options. World J Gastroenterol. 2015;21:12211-7.
- [CrossRef] [PubMed] [PubMed Central] [Google Scholar]
- Molecular characterization of gallbladder cancer using somatic mutation profiling. Hum Pathol. 2014;45:701-8.
- [CrossRef] [PubMed] [PubMed Central] [Google Scholar]
- Genomic spectra of biliary tract cancer. Nat Genet. 2015;47:1003-10.
- [CrossRef] [PubMed] [Google Scholar]
- Treating biliary tract cancers: New targets and therapies. Drugs. 2022;82:1629-47.
- [CrossRef] [PubMed] [PubMed Central] [Google Scholar]
- Diagnostic value of quantification of cell-free DNA for suspected gallbladder cancer. JGH Open. 2023;7:748-54.
- [CrossRef] [PubMed] [PubMed Central] [Google Scholar]
- Diagnostic value of circulating free DNA integrity and global methylation status in gallbladder carcinoma. Pathol Oncol Res. 2019;25:925-36.
- [CrossRef] [PubMed] [Google Scholar]
- An analysis of variance test for normality. Biometrika. 1965;52:591-611.
- [CrossRef] [Google Scholar]
- Primer sequences for PCR amplification of β-globin gene. J Mol Diagn. 2006;8:213-9.
- [Google Scholar]
- The clinical landscape of cell-free DNA alterations in 1671 patients with advanced biliary tract cancer. Ann Oncol. 2022;33:1269-83.
- [CrossRef] [PubMed] [Google Scholar]
- Diagnostic value of quantification of circulating free DNA for gallbladder cancer using a chemiluminescence DNA biosensor system based on DNA G-quadruplex/hemin enzyme. Transl Oncol. 2021;14:100928.
- [CrossRef] [PubMed] [PubMed Central] [Google Scholar]
- Diagnostic and prognostic value of circulating cell-Free DNA for cholangiocarcinoma. Diagnostics (Basel). 2021;11:999.
- [CrossRef] [PubMed] [PubMed Central] [Google Scholar]


